

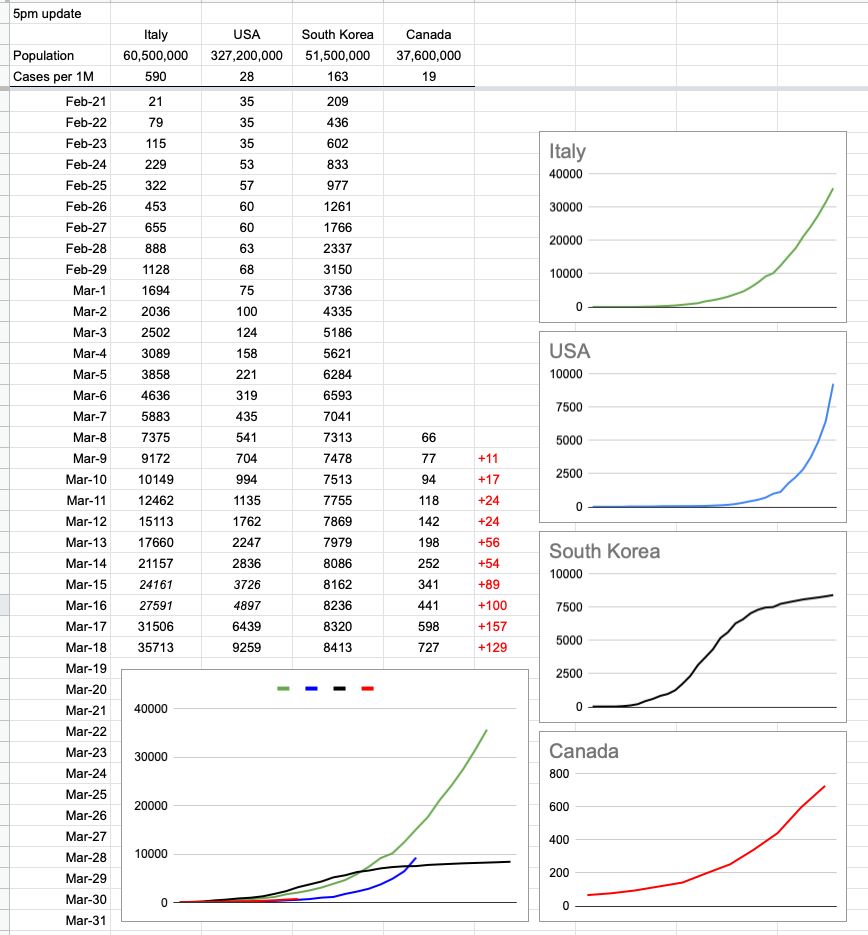
Follow-up to yesterday’s post… and I will try to update this daily, around 5pm. To make it consistent, I’ve normalized the numbers for that. The data comes from https://www.worldometers.info/coronavirus/
The individual Canada chart looks a little curvier than it did yesterday, but that’s only because I added a bit of earlier data and while the trend was indeed increasing, the historical numbers are small. Check the y-axis, not just the pattern.
Also, while yesterday saw an increase of 157 cases nationally, that number was lower (129) today, according to this source of data. And that’s what it’s all about… slowing the growth, because it will grow for the foreseeable future. The question is how fast.
I’ve also added South Korea as an example of how it looks when you do things right; that is the trend everybody wants to see. Still growing, but way slower than before.
View Original Post and All Comments on Facebook
Leave A Comment