British Columbia

Day 23 – April 8, 2020

Back in 2007, a friend approached me. He’d started a company some years earlier, and it had reached a turning point. We talked about what it needed to take it to the next level, and I saw enough potential in it to get involved. He was the CEO, he had a vision, and I shared it. OK, let’s do this. As part of it, I also brought in one of my closest friends, and together we built it from a handful of people to an industry leader. In reality, those two built it with their day-to-day hard work. I just threw in my two bits when needed. Early last year, we sold it to a much larger company. A very nice success story.

Yesterday, I had a Zoom call with those two. One of them is the former CEO. The other is the former president, but still runs what used to be our company as a subdivision.

And it wasn’t a great call… just an update to let us know that our acquirer, themselves now facing top-line revenues that were 15% of original projections, had to let a lot of people go, including many of the key people who’d help build our success story. It knocked our piece right back to 2007. The worst part of it was hearing the names… these great, talented people who’d been such an integral part of building this thing… all out of a job.

Also yesterday, I had a very nice chat with a reporter who covers horse racing. She wrote a very nice article which you can see directly below this post. As much as it was a discussion about me and these posts, it also got into a much larger discussion with respect to the horse racing industry and the people it employs… including her. A sports reporter without any sports to write about… now what.

Like so many businesses and industries and people these days, very few have worst-case scenarios designed to deal with zero revenue. A pub might have a great month because the weather was good and the patio was open and jammed with people enjoying the sunshine. Or what could have been a great April and May were not, because the Canucks missed the playoffs. The guys in the offices have lots of fancy spreadsheets where they plug in numbers and run lots of different “What If” scenarios. But none of them ever plug in zero at the top, because zero at the top means you don’t have a business. Unless you’re Apple, and sitting on hundreds of billions of dollars in cash, you’re presently in completely uncharted territory.

Having had that discussion about horses yesterday, I woke up this morning really missing it. This beautiful sunny morning, exactly the sort of day where in that parallel universe — the one where the Canucks clinched a playoff spot a few days ago and are preparing for round 1 — I’d be heading off to the backstretch at Hastings Park, where I’d park myself at the gap, the rising sun behind me to the East, and watch horses, some of them mine. The smell of the barns, the hay, the horses, the mud. The sound of distant hoofbeats getting louder as the horses approach, and then fade away as they round the turn. The sight of these beautiful animals in full flight, sun glistening and steam rising off their bodies. Words don’t do it justice… but if you’ve never experienced it, that might give you some idea.

And then there’s the people, of course. I miss that crowd… the backstretch of any racetrack is its own society, and for lack of a better way of describing it, a “flat” one. Whether you’re the wealthy owner writing cheques or whether you’re the hard-working groom who’s up at 5am mucking stalls, everyone is there for the same reason, that same passion. Anyone can — and does — talk to everyone else, at the same level. An eclectic collection of peers. But there is also a big difference… for me, this is just a hobby. For them, it’s their livelihood, and in some cases, their home. There is uncertainty at every level.

Those of you who think you’re considered to be nothing more than expendable little cogs in a big machine… I assure you, you’re not. Whether you were writing software or serving beers or mucking stalls… and now, for the moment, are not… there is someone, somewhere… in a cramped little office, after a sleepless night, stressed out looking at a scary-looking spreadsheet. That spreadsheet these days has a lot of red numbers. And that guy feels bad. Really bad. Not because he’s not rolling in the cash, but because he knows you have rent to pay and mouths to feed. He wishes he could do more for you, and in many cases, he does. He wants that light at the end of the tunnel as badly as you. He wants you back at work. He wants to have work to give you.

I think if I ever had to go to prison, and were given a choice…. one option is a 10-year sentence. The other, unknown: you might get out tomorrow. Or, you might never get out. Every day, the same thing. Maybe you’re going home today. Maybe you’re not.

Given what I’m experiencing today… indeed, what we’re all experiencing… I think I might go for the 10 years. That’s a dreadfully long time to be locked away, but at least you can wrap your head around it. Set goals, set expectations, figure out how you’re going to fill that time.

I think what a lot of us are feeling these days is the despair that comes along with the uncertainty. Tell us when we can get back to normal goddammit… just tell us. I get it, and I feel it too. I don’t have the answers either, but one of these days I’ll give my version of what I think that finish line looks like… because there is one… the when and how. It’s on the horizon, but nobody is quite sure how distant… yet.

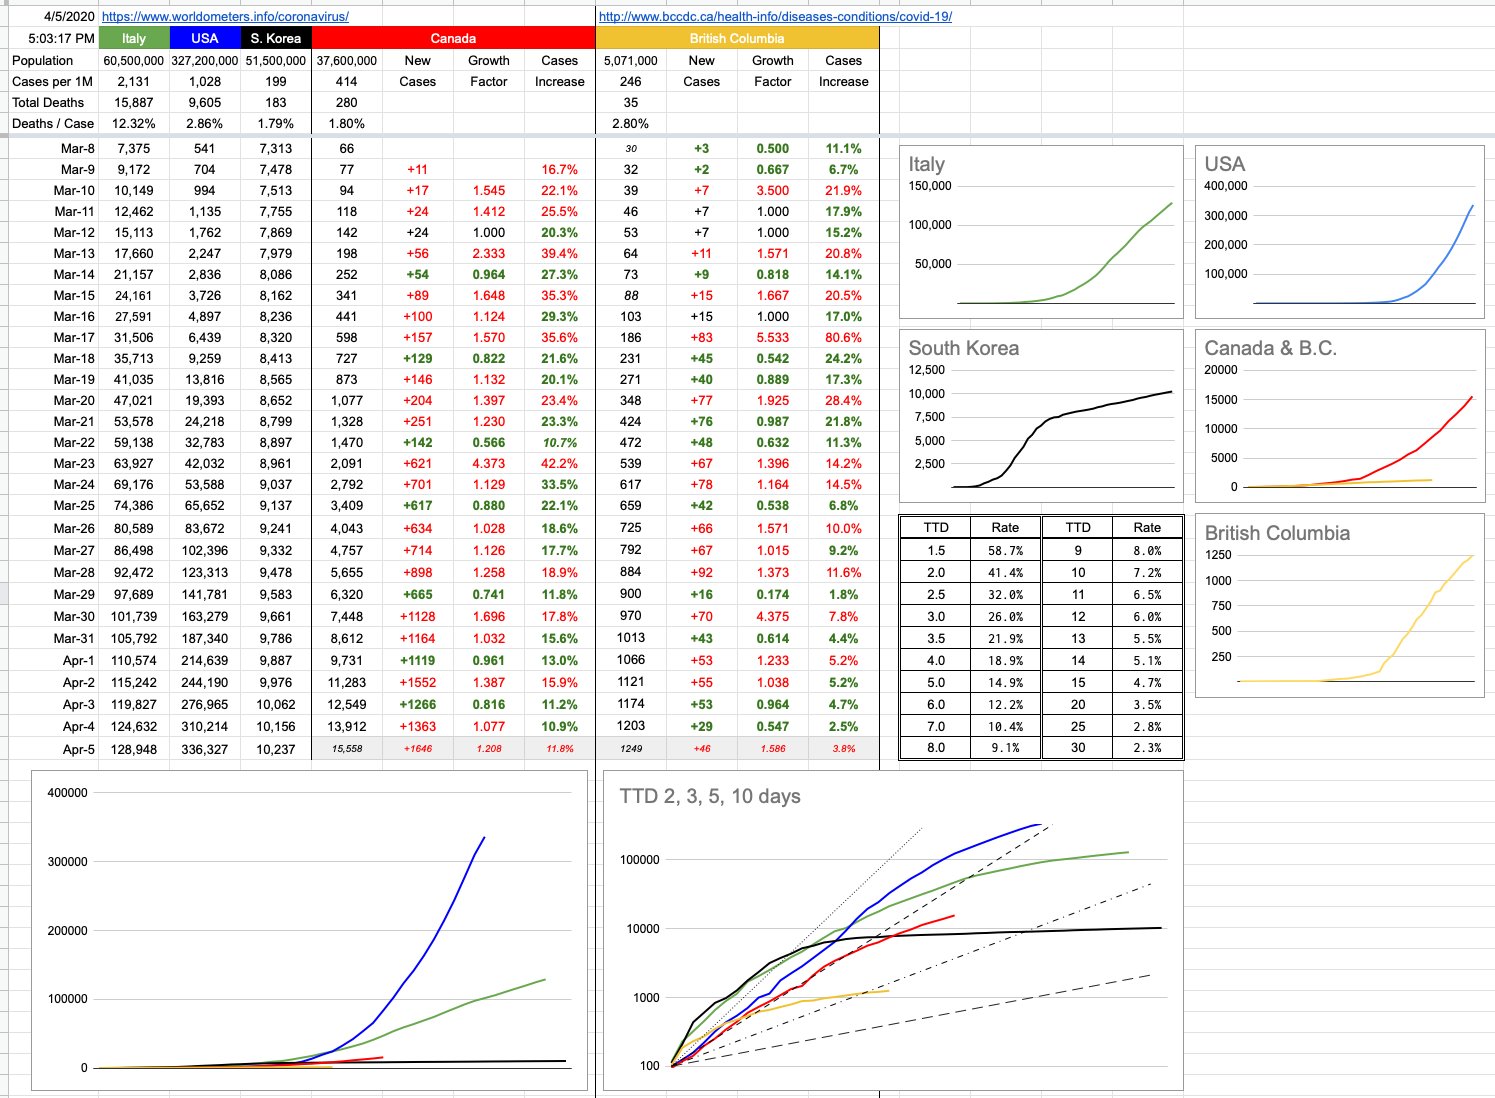
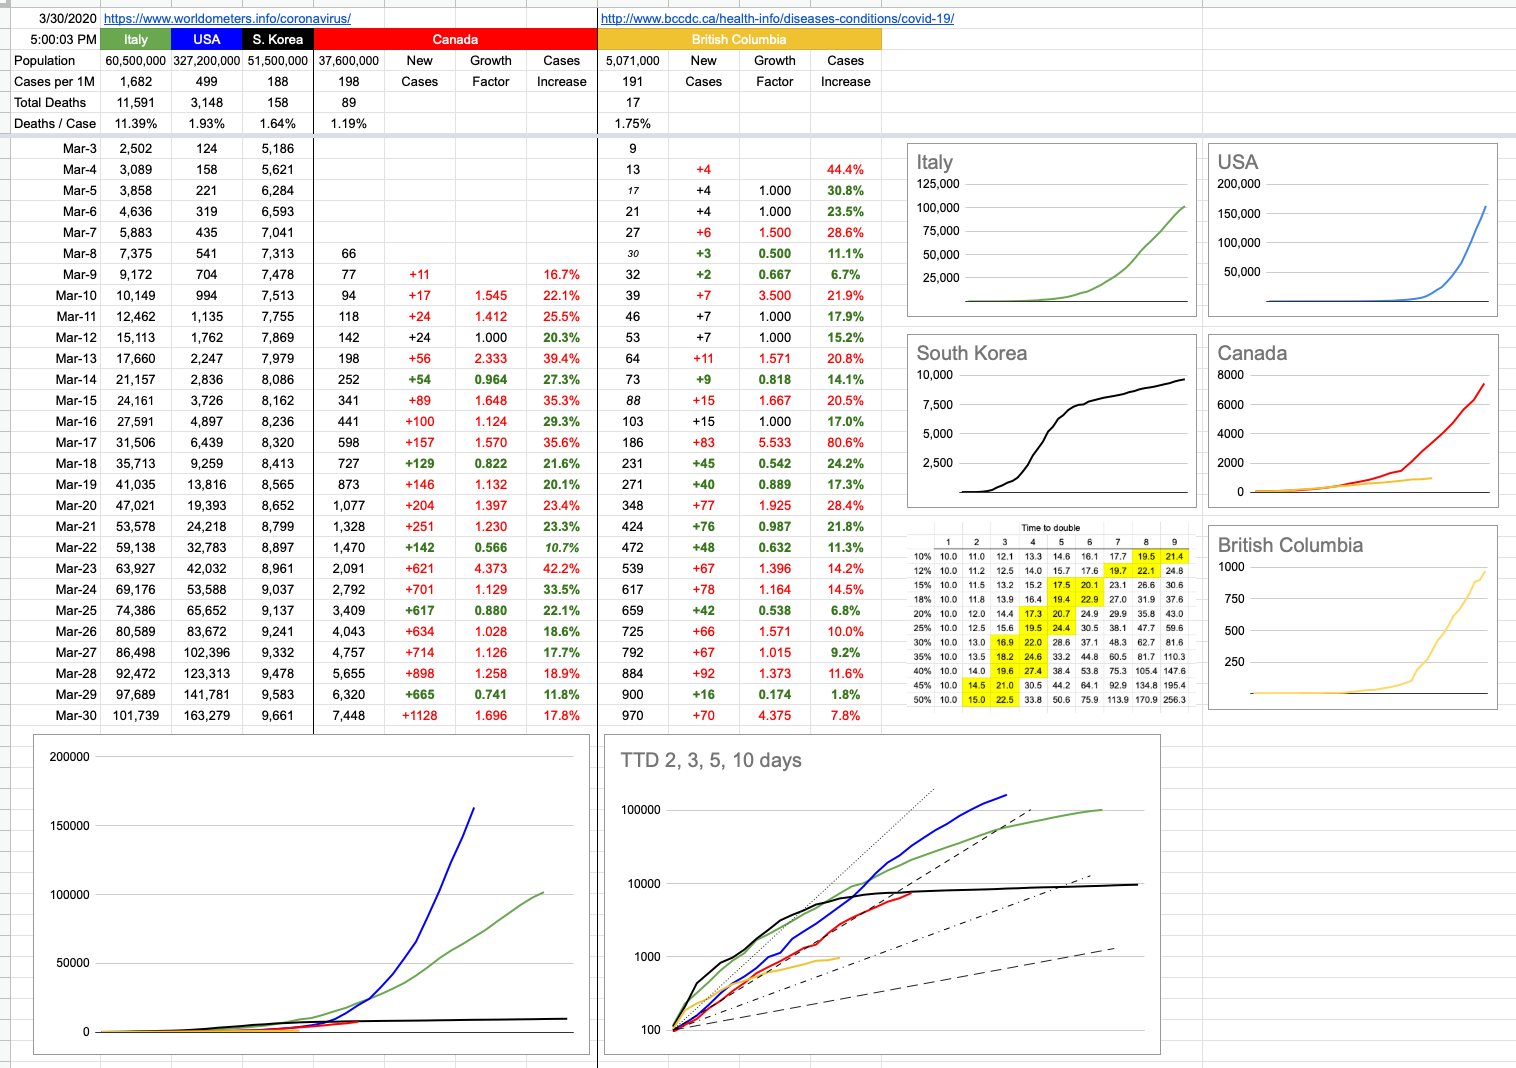
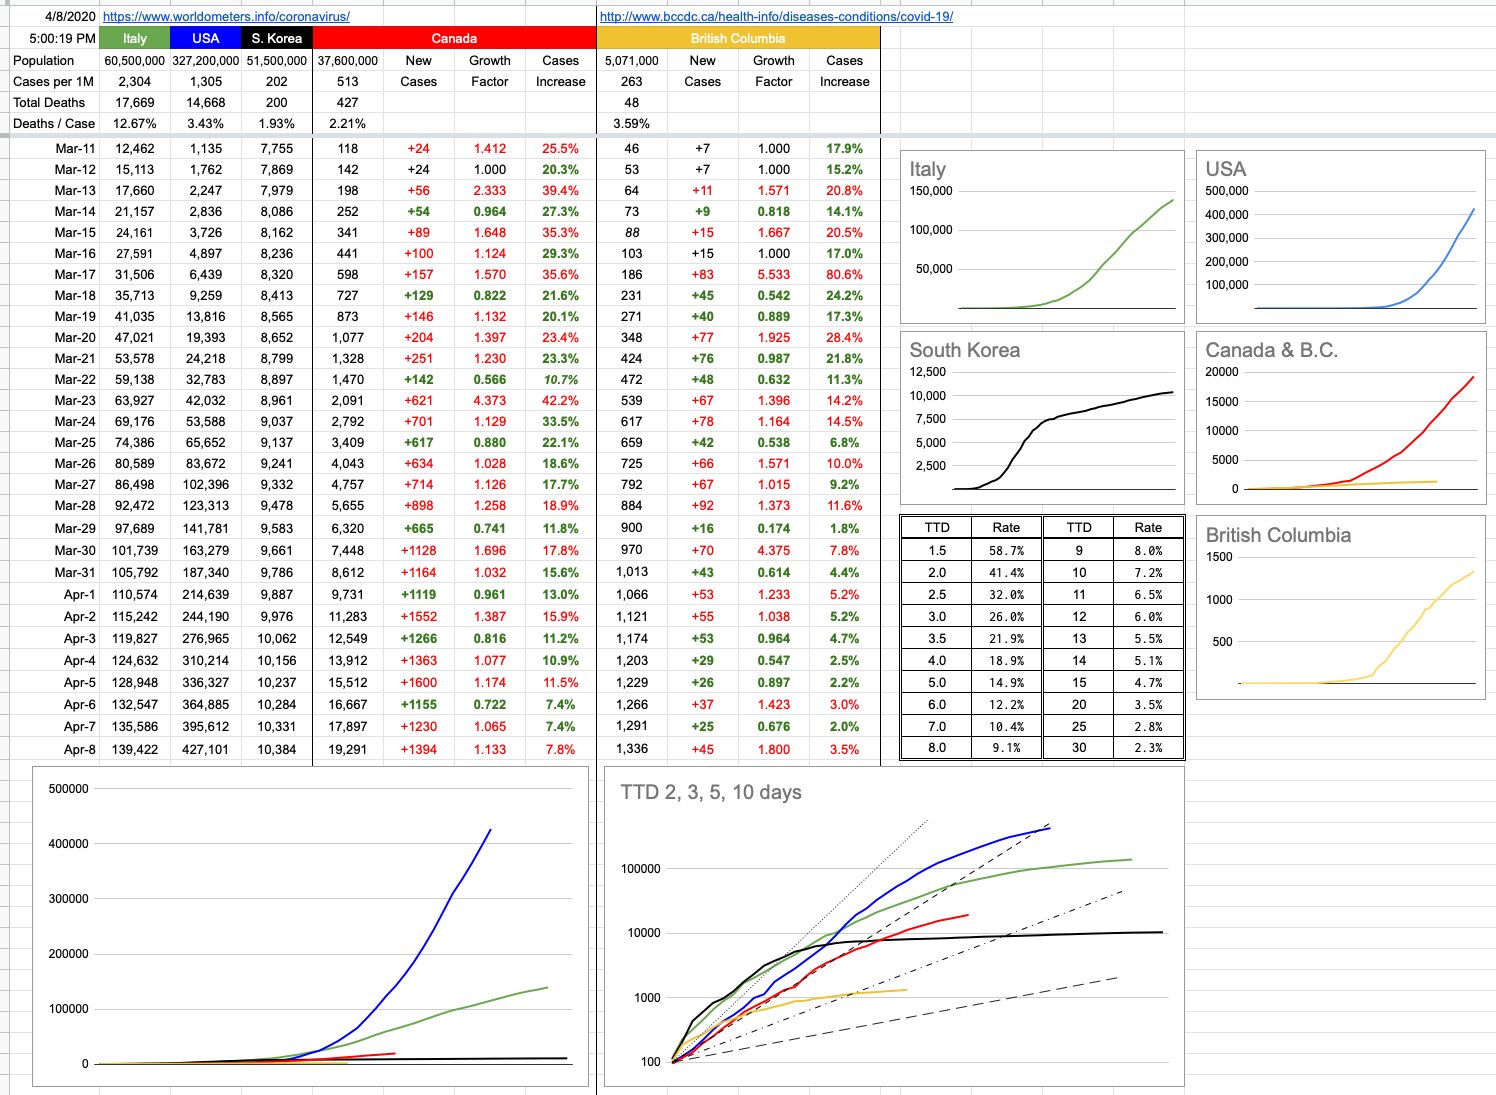
For now, we’re here today, so let’s look at some numbers…

It wasn’t a great day out East, as far as numbers go… but it’s actually not as bad as the first impression might imply. Ontario saw an increase of 550 confirmed cases, which is a jump of 11.6% from the previous day… but the average increase over the last three days there is only 9.3%… and the 3 days before that were 13.1%. And the three days before that were 17.9%. While I’m at it, let’s do the same for Quebec… their 3-day average daily increase including today is 7.9%. Three days previous, 13.2%. And the three days before that, 17.3%. As far as trends go, this is exactly what you want to see. A one-day spike doesn’t necessarily imply a sudden, drastic turn of events. Indeed, here in B.C. we saw 45 new cases… which is the highest one-day increase in 5 days. But then again, it’s only an increase of confirmed cases of 3.5% over yesterday.

Everyone — just listen to your respective chief medical officers. And if you don’t like what yours is saying, listen to ours — she’s awesome, and she’s right. We’re doing it. It’s working. It’s not magic; it’s science. But we’re not there yet. Stay at home, physically isolate, and do your part… we’re getting there.

View Original Post and All Comments on Facebook

Article in Canadian Thoroughbred – Horse Owner Horatio Kemeny Reaching Many

Horse Owner Horatio Kemeny Reaching Many With Informative Posts

Swift Thoroughbreds’ Kemeny has attarcted a large following with his daily graphs and chatty write-ups about BC and Canada’s battle against COVID-19

View Original Post and All Comments on Facebook: 133 Likes, 25 Shares

Day 22 – April 7, 2020

When Her Royal Majesty, Queen Elizabeth II, took to the airways recently to address her nation, it was only the 5th time in her 68-year reign that she had done so (other than to say Merry Christmas). And when I say her nation, I’m not just talking about the U.K., and I don’t just mean the British Commonwealth, whatever is left of it, though it’s somewhat eyebrow-raising to realize that she has been Canada’s reigning monarch for 47% of this country’s existence… but no, her nation is the world. When you reference “The Queen”, nobody asks you which queen you mean. We’re not talking about the queen of Sweden or the queen of Spain or the queen of Bhutan. Or Beyoncé. There is only one Queen.

The rarity of this sort of event underlines its importance. In time of war, in time of national mourning… when everyone needs a serious dose of encouragement.

Before she even opened her mouth, the picture spoke thousand words. The setting was like a glorious painting, liberally sprinkled with meaning. The bed of roses, because life is beautiful, but sometimes a little thorny. The single lamp, off in the distance — the proverbial light at the end of the tunnel. The blank slate; the future unwritten. The empty office holders — signifying the paralyzing of business — which one day again will hold pens, paper clips and postage stamps (no doubt with her ubiquitous silhouette).

Then there was the Queen herself, looking radiant and royal and confident in green — the colour of nature and Spring and renewal. Her trademark pearls. I looked up what turquoise might represent, because that was the stone at the centre of that incredible brooch: Healing, love and protection. Perfect.

And, of course, there is what she said. The final sentence of her address was this: “We should take comfort that while we may have more still to endure, better days will return: we will be with our friends again; we will be with our families again; we will meet again."

It’s hard not to read that in her voice. Strong, powerful words, spoken with an accent that exudes class and elegance to a level we can only hope to achieve. Those familiar with the history of World War II (and/or the music of Pink Floyd) will recognize the reference to Vera Lynn at the end of it; the war-time song that kept them all together during those darkest of times: “We will meet again”.

Indeed, it’s been a brutally difficult few years for our friends across the pond. Long before this pandemic hit, they were wrestling with Brexit… an enormously complex problem that has no Plan B. It simply can’t be allowed to fail because nobody is sure what that would look like, but they all agree it’s ugly. Very. And in the midst of trying to push it over the finish line, oh, let’s throw in a global pandemic and see how that affects things. The answer is… not well.

There’s a lot to learn from the U.K.’s COVID-19 experience, because their attitude was initially quite different, and its effects are worth exploring.

Their initial assumption that this was just a bad flu that would course its way through the population eventually (and hopefully quickly) establishing herd immunity. It was thought that this would only harshly affect elderly people, and that people whose age was below a certain threshold might get affected, but they’ll get over it, and there’s really no reason to panic because as long as we isolate those at risk (elderly, immunocompromised, asthmatic, diabetic, etc), this shouldn’t overwhelm the medical system.

By the time that attitude was course-corrected and social distancing imposed, things were already launched in a worrying trajectory. This was far more virulent and serious than initially thought. The lockdowns are now in place and how it plays out remains to be seen, but those critical few days of “not a big deal” and people going about their business… have made a big difference. Prime Minister Boris Johnson, the fearless leader (and the man tasked with delivering Brexit) was proudly going about shaking hands with people, including those in hospital… only a few weeks before his own positive test. Today he finds himself in the ICU of a London hospital, battling for his life.

Closer to home, where we are all taking social/physical distancing seriously (right?), especially this long weekend with its good weather and where even though there are holidays coming up that are usually big family gatherings, we will do all that remotely (right?) — as Dr. Henry and Mr. Dix keep hammering home, we are in the midst of this. And we are succeeding. They don’t want to come right out and tell you that, but I will. Barring a significant very-out-of-left-field sort of thing, we are looking very good here in B.C. But what sort of thing might that be? Glad you asked, because it’s exactly what they’re telling us… if you go out these coming days and pretend things are ok, and you hang out with family and/or you visit the family cottage, then guess what… things can go from great to gruesome in a hurry.

Our dynamic duo always talk about the coming weeks, but we all know we’ve been cooped up for longer than 14 days, so what’s the deal? The deal is this… if you think things are so good right now that we can just get back to normal, what will happen is a sharp increase in cases starting… well, starting shortly after the long weekend and extending to 14 days past that. And if that happens, if just a few people let up, it can make a big difference. The actions of the coming weeks will make all the difference.

Listen to The Queen. Hang in there. After much to endure, there’s a finish line. We will meet again.

View Original Post and All Comments on Facebook

Day 21 – April 6, 2020

When you’re on a plane, approaching the end of a long flight… if you happen to be paying attention at about 30 minutes before landing, you may notice the hum of the engines drop a semi-tone or two. And you will feel the nose of the plane pitch forward slightly. This is the result of the pilots reducing power to the engines, which is the first step of many needed to land the plane safely. It takes about 30 minutes to bring an airliner flying at 35,000 feet and 500 knots down to 0 feet and 0 knots. Indeed, there are ways of doing it much faster than that, and they’re highly not recommended. If you want to get the plane and all its occupants down safely, it’s a process, and that’s how long it takes. But what if we just “dive steeper”? Or just crank the engines and point it down and “go down faster”?

Anyone who’s ever pitched a proposal can tell you what two questions need answering first: how much will it cost and how long will it take. The cost is often negotiable. The “how long” often is not. Some processes can’t be altered nor compromised nor made better nor anything. You want a baby? You need a man and a woman and 9 months. Well, jeez… I’m in a hurry… what if we put 9 men on the job… can we have that baby in a month? Uhhh…. no.

That plane is in the hands of two people who know what they’re doing, and we put our trust in them, and they always seem to deliver. But if you happen to be sitting back in 29B, sitting next to “an expert” who’s explaining to you everything the pilots are doing wrong (“Hey see how that flap extended, man that’s gonna slow us down and burn more fuel, that’s no good, why’d he do that”), then you might understand how I’m feeling today after posting something yesterday that an awful-lot more people than usual read.

I like my plane metaphor, because it’s useful in two directions.

Number one, and more important… today is “double-header” day here in B.C. — we get both yesterday and today’s numbers of new cases, and that can go one of three ways… two wins… or two losses… or a tie. A quick eyeballing of the days leading up to today would imply that anything below a 5% case increase would be a win for either day. Less than 4% on both or either would be great.
The numbers were 2.2% and 3.0%, which are both really excellent. But as our resident captain and co-pilot keep telling us, we haven’t landed yet. Stay in your seat and keep your seatbelt fastened. We’re not there yet. And if you stand up now, we might hit some turbulence and you could get really hurt, or hurt someone else. See? Good metaphor.

Number two, I find it fascinating that everyone who 6 months ago was an expert on impeachment hearings and the way the senate works and immigration and indigenous rights… is today an expert epidemiologist.

The best evidence I have that I’m no expert is that it just took me quite an effort to spell that word correctly. And I don’t claim to be. I am an expert with computers, and I’m pretty good with numbers and I suppose I have a way with words… which leads to this possibly entertaining and hopefully informative but in no way expert opinion of what’s going on around us. Give me some numbers, and I can make some pretty graphs with pretty colours. I can map some tables with pretty informative numbers too. And, if you’re still reading at this point, can evidently write about it in some engaging fashion. I can tell you what’s going on from my own, unique point of view.

I feel the need to mention this so I can address this issue of “the numbers are all wrong so this is all B.S” which I see both publicly and privately. Sure… notwithstanding you’re not even a photographer, those shadows don’t look right and why aren’t there any stars in the background… clearly, the moon landings were faked. And here, give me the controls, I can land this plane. I saw it in a movie once.

These numbers are all we have, and, at present, they are serving us well. Some are straightforward. Some are inferred. Some are assumed. A lot of great minds are coming up with these numbers, and they’re in-line with what we’re experiencing. I can’t speak for the rest of the world, and I’m only going with what the credible sources tell us, but in general, those numbers are lining up with the associated experiences around the world. I am also, along with everyone else, waiting for the local emergence of a quick and accurate at-home serological antibody test… the test that will detect whether you’ve ever had the virus. And not just here. Everywhere. Actual science, not guesses and assumptions based on ignorance or hope. That will answer a lot of questions. That will verify the numbers. Or prove them all wrong.

Either way, until then, I’m going with the science.

View Original Post and All Comments on Facebook

Day 20 – April 5, 2020

When the historians who will ultimately document the great pandemic of 2020 begin their work, they will be asking themselves some tough rhetorical questions, many of which will begin with the words, “I wonder why they didn’t….” Indeed, some of those questions are being asked today, in the present tense, and good answers are not forthcoming. When those historians finish their books, most of them will have a chapter titled, “The United States of America”. Often, underneath the chapter name, there is a chapter subtitle… sometimes a little more detail, sometimes a quote. Usually in italics… you know what I mean. This particular subtitle will say:

“I don’t take responsibility at all” — President Donald J. Trump, March 13, 2020

Today is Sunday, “silent day” here in B.C., where the people upon whose words our futures (near and far) may depend, take a well-deserved break. Indeed, as loud as it gets at 7pm every night around here… it gets just as quiet at 3pm on weekdays when the only words you might hear are, “Shut up — Dr. Henry is speaking”. Today is their day off, so my B.C. number is just a guess bases on the averages of last week — I will fix it tomorrow when we get real data. But I’m guessing it’s pretty close.

Until recently, none of us had even heard of Dr. Bonnie Henry… but now, we all want to adopt her. And it’s not just the calm, soothing voice of reason that’s so enchanting… it’s the actual substance of what she’s saying. She’s not making it up as she goes along. She’s not up there to make herself look good. She’s not up there incoherently throwing blame around. She’s surrounded herself with excellent people who she consults on a continual basis. She’s not afraid to admit she was wrong, and, accordingly, she’s willing to course correct… which, if you read back on the evolution of this emerging pandemic in B.C., has happened more than once. She is, in every sense of the word, a leader.

On the day Donald Trump spoke those words, there were 2,300 known cases of COVID-19 in the USA. By that point, Italy was well aware they had a serious problem on their hands. They were at close to 20,000 cases and growing quickly, and they had begun throwing the proverbial kitchen sink at it in every feasible way. Pandora was out of the box, and the trajectory was not looking good. Everybody was paying attention, and everyone was making plans.

In Canada, on that day, there were 198 known cases, 64 of which were in B.C. If we were to map our growth rates to match what’s happened in the U.S., Canada would presently have 29,500 cases (we’re at 15,500) and B.C. would have 9,500 (we’re at 1,250 or so). And Italy, had they continued that same trajectory, would presently be looking at 26,300,000 — an unlikely number for other reasons, but that’s what the math implies if you leave this thing alone to propagate unchecked in an environment that could support that growth.

On March 13th, here in B.C., the only orders that were In place were that travellers returning need to self-isolate for 14 days, and that all gatherings of more than 250 people should be cancelled. Physical distancing as we know it today had not yet been implemented. And as we all know, a lot has changed since then… here, at least… not the least of which are the social distancing orders.

There are places in the U.S. at this moment where none of these sorts of orders are in place, and if they are, they are not being taken seriously or enforced. It boggles the mind to think that while we’re having a quiet Sunday here, there is a church in Louisiana where today 26 busloads of people arrived for services. People want to start talking about how we emerge from this, and it’s a complicated question because the world is a complicated place, where lots of different things are going on in lots of different places. The answer to how and when B.C. emerges from this will likely be very different than Louisiana.

B.C. has a population of 5 million. Louisiana has a similar population of 4.7 million.
On March 13th, B.C. had 64 cases. Louisiana had 77.
Today, we have 1,250 cases. Louisiana has 9,150.

What a difference real leadership can make.


View Original Post and All Comments on Facebook

Day 18 – April 3, 2020

By now, we’ve all settled into some sort of routine… or, at least, the intention of one. 3pm-5pm is my “Corona time” — not because I sit back to enjoy a refreshing Mexican beer (and my preference would be Guiness anyway), but because I’m trying to give this aspect of my life a limited and structured block of time. I listen to the provincial 3pm update from Dr. Henry and Mr. Dix while digging through articles and messages I’ve received, updating numbers, and writing this… and 10 seconds after posting this, shortly after 5pm, I try to forget all about it for the next 22 hours. Much easier said than done, but distraction helps.

If you’re reading this post on Facebook, then you have at your disposal the technology to distract yourself in isolation forever… with endless books, music, videos, movies… all at your fingertips. Distract yourself to your heart’s content with all of that… or just send memes and pictures of cute cats to your friends; whatever keeps your brain in a happy place.

And, of course, connect socially — not physically. You know, of all the whacked-out conspiracy theories I’ve heard — and I’ve heard many — if I had to believe one, it’d be that this virus was created by the people who are behind the Zoom software.

To Zoom’s credit, they took advantage of this situation very intelligently. Luck = preparation + opportunity, and lucky they were… but also smart. They announced that their software would be unlimited and free for educational purposes. Every school jumped onto it. They also made it free for everyone, sort of. Up to 100 people can communicate for free, for up to 40 minutes. It’s genius, because if you manage to get a large group together for free for a 30-minute meeting… and the meeting invariably drifts toward that 40-minute mark, the hassle of hanging up and starting over is superseded by the simplicity of just signing up. Somebody on that call will sign up. We are all signing up in droves. And above and beyond all of that, they understood where the “friction” was, and removed it. Setting up a conference is easy. Joining one, even if you’ve never done it, is simple. Jump through a couple of hoops and you’re in, and once you’re in, the next time is trivial. The days of tying up the first 15 minutes of any videoconference with “We can’t see you” and “I see you but can’t hear you” and “How do I unmute this” and “It won’t install” and “What’s the admin password” and “I’m getting an error… wait…” and so on… those days are over.

A company that many of us hadn’t even heard of a month ago is now worth close to $40 billion. And for those that know what it means, has its shares trading with a P/E ratio of 1,500. For comparison, Amazon’s P/E is 80. Apple’s is 20.

Whether it’s Zoom or whatever else you many be using, this has radically changed the way we socialize and, to a great extent, I find myself Zooming with people I haven’t seen in ages. Like, there is a particular group of people I’ve been hanging out with, on and off, for over 30 years. Before the internet (as we know it) existed, we were a bunch of geeks who connected via modems… which ran at speeds so comparatively low to what we have today, you’d think we’re kidding. We used to go for burgers and beers every week, but as people grew up and evolved into real lives, those meets got few and far between. But guess what we did last week — got together on Zoom, geeked out discussing technology, asked a lot of “Remember that time when…” questions, watched a bit of Demolition Man together, and watched each other eat burgers and drink beer. It was wonderful. Guess what we’ll be doing every week.

Yeah, it’s not the same, but how lucky we are that we have this technology to stay connected. Let’s milk it for all it’s worth. A virtual hug is nowhere near the same as a real one, but it’ll do, for now. Stay at home and reach out to all your friends and consume the gigabytes of free data being generously offered to us by our internet providers.

Back to today… this post didn’t talk a lot about numbers, because around here… B.C., and Canada in general — we’re in this sort of “hurry up and wait” phase. As optimistic as the B.C. numbers look, it’s exactly not the time to take our foot off the collective gas pedal. Don’t go dancing in the streets. Dance all you want in your living room. And if you’re don’t remember why, read yesterday’s post. Once the weekend numbers have settled down early next week, we’ll see where we’re at, and by then, there will be plenty of trending data to discuss. But don’t worry — even if I have nothing meaningful to say, or what I say seems to be irrelevant… the numbers and charts always have something to say and I’ll keep posting them daily while we’re all here.

And finally, in other news… I visited my car for the first time in a couple of weeks and found a 2-week-old Starbucks Iced Latte there. The mold/fungus/bacteria/whatever-the-hell-it-was growing in there may well have held the cure for COVID-19… but we’ll never know.

View Original Post and All Comments on Facebook

Day 17 – April 2, 2020

I added a little table (just above the logarithmic chart) to the spreadsheet yesterday, and today I will explain it. It’s a simple “look-up” table for “Time To Double”, useful if you want to know how a certain percentage maps to a TTD. For example, let’s say you have $1,000 to invest, and you want to double it to $2,000 in 7 years. What interest rate would you need? The answer is 10.5%. If you can wait 10 years, you’d only need a rate of 7.2%. How long to double your investment if you’re being offered 20%? The answer is 3.8 years.

These percentages and their related time periods can measure years… or days, which is the relevant discussion.

Let’s begin with a simple example, where we start with the number 100. And we are adding 20 to it every day. After 5 days, it’s doubled to 200. A TTD of 5. Now we keep adding 20 per day… so it’s going to take another 10 days to go from 200 to 400. And to double from 400 to 800, it’ll require a further 20 days. The only thing doubling here is the TTD itself… and this represents linear, not exponential growth. Certainly, it’s growing… and in this example, that 100 will grow indefinitely… but, as it does, its TTD gets bigger and more distant.

Now let’s imagine an example where on day 1, we’re at 100. But by day 4, we’re are 200. And at day 7, we’re at 400…. and we’re at 800 after only 10 days. So this is clearly a TTD of 3, and if you look at the continuing growth… 800, 1600, etc… it’s not hard to imagine what this would look like on a graph… an ever-increasingly steep curve. With a consistent TTD, there is exponential growth. The steepness of that curve has everything to do with the actual TTD, and that’s important because no matter what the finish line, it’s important how quickly we get there. In this case, we want to get there as slowly as possible.

The big graph on the bottom left shows those curves, overlapped on each other, showing how numbers have evolved for different jurisdictions from similar starting points. The logarithmic graph to its right shows the same data, and when you graph exponential data on a logarithmic scale, consistent exponential growth shows up as a straight line. Those 4 TTD lines of 2, 3, 5 & 10 days are the best example. A logarithmic presentation also helps to show the deviation, positive or negative. As that exponential growth increases or decreases… ie, as the TTD increases or decreases, the lines for each country (or province) will move… and obviously, to the left (into the steepness) is bad, and to the right (flattening out) is good.

Logarithmic graphs can be a little misleading in the way they squish data, and can misrepresent reality. But from the point of view of displaying trends, they’re pretty good. We can look at the encouraging B.C. line. We can look at the Canada line, and at least relate to the fact that we’re on a very different trajectory than what the U.S. is following. As much as the numbers back east have jumped, and as exponential as the growth continues to be, it’s less exponential, ie slower, ie the TTD has gone up, ie… from a trending point of view, not worse than what led up to it.

Even without the graphs, the numbers speak for themselves, and the growth percentages are there, day to day, both for Canada and for B.C. You can plug those numbers in to the little table… from today, from a week ago… and see what TTD would correspond.

That being said, what exactly are we measuring? These TTDs are important to chart the rates of growth, but rates of growths of what? Known cases? Presumed cases? Hospitalizations? Patients in critical condition? Deaths?

The only thing I’ve been dealing with are confirmed cases and their growth. My data deals with the confirmed known spread of the virus…. but all of those other numbers are also important, and will be tackled in due course. Topics for another day.

View Original Post and All Comments on Facebook

Day 15 – March 31, 2020

You know that feeling you used to get back in school, when the teacher was handing back tests? The anticipation/dread… moments away from finding out how you did. Maybe you should’ve studied a bit more. Maybe you knew the material, but dammit… you froze, and blew it. Maybe you did ok, but almost certainly you made some stupid mistake.

That 5-second rush of emotion as she calls your name or just drops the marked test onto your desk… just before you flip it over to reveal your grade… that’s the feeling I get every single day when Dr. Bonnie Henry steps up to the mic to begin her update.

I find myself rooting for what I know would be good numbers. I know my charts and I know the math. I know exactly what number indicates the tipping point between this being a green day or a red day… and I find myself thinking the same thing I’d be cheering if I’d just bet zero on a roulette wheel… come on green. Come on.

Today was most certainly a green day, but, as usual, we’re still in this grey zone. Dr. Henry, intelligently, never leans past cautious optimism, and keeps talking about how “we’re two to fours weeks away from knowing”. and “this is a critical juncture”.

There are two parts to that.

Keeping in mind that we’ve been locked-down longer than a week, and that the incubation period is at most 14 days, we’re less than a week away from knowing what that particular impact has looked like. All indications with respect to that are optimistic. There’s no doubt our numbers in this province are trending favourably. For now.

BUT… there are people who will have gotten sick after that cut-off. And the people they’ve infected. And people who’ve arrived since the cut-off, and the people they’ve infected. And the people who are simply not following physical-distancing guidelines, etc. It takes a while for all of that to work its way through.

Along with that comes a serious reality check which is now being brought to light… that if this whole lock-down thing is the right way to do things (and it certainly is), we need to be prepared to do it for quite a while. At least in B.C., there’s zero chance of any of these standing orders being modified before the end of April, but it’s likely to be a lot longer.

Looking at the rest of Canada… there are some possibly-concerning numbers coming out of Quebec, but what’s interesting is that overall, the country’s numbers are doing reasonably well. I’m not close enough to what’s going on in Ontario and Quebec to say anything intelligent about it, other than to point out that Ontario has twice as many cases as B.C.. and Quebec has twice as many as that. Those combined ON/QC numbers are going to strongly influence the national numbers. Kind of like a federal election. Out east, they’re on their own “lock-down period vs. incubation period” countdown, so let’s wait till they’re clear of that before we start making assumptions. There’s green in that column too.

View Original Post and All Comments on Facebook

Day 14 – March 30, 2020

In Stephen Hawking’s remarkable book “A Brief History of Time”, he mentions in the introduction that he was advised that each formula he put in the book would halve the sales. Zero formulas, one million sales. One formula, half a million sales. Two formulas, a quarter-million sales. And so on.

By the way, that is exponential growth (well, decay, in that case). Which is what I’m going to talk about, but it’s also why I will try to include as few formulas as possible. Let’s stick to what’s important. Like, driving a car. Gas pedal, go. Brake pedal, stop. Steer where you want to go. That’s basically it, and you don’t need to understand the magic taking place under the hood to make good use of the car.

So, speaking of cars… let’s say you’re in your car, and you want to go from 0 to 100 km/h. My first car did that in about 18 seconds. My current car does it in 2.9. Both of those numbers are insane, but for completely different reasons.

Let’s look at the new chart I’ve added, which is a logarithmic graph of all the same data… and some dotted-dashed lines I’ll explain below.

You car will follow an acceleration curve, which… interestingly, for a supercar like a Ferrari, will look a lot like the Italian line on the logarithmic chart. A more modest car, like a Kia, will look more like the South Korea line.

Ooohhh, wait a minute, we might be onto something here…

All cars eventually hit a top speed where they are no longer accelerating, and when they do, like the Kia/South Korea line almost has, it flattens out to a near-zero slope. That Ferrari/Italy line will flatten out too, eventually, but as we can see, at a much higher level, and it’s not there yet… but trending that way.

The Canada line has been skirting the left side of its attached dotted line, and is now a little on its right. What’s it most looking like? Thankfully, very evidently, not the MegaSupercharged Corvette/US line, whose pedal is still floored and heading to a scary top speed. Whether Canada trends more like South Korea or Italy depends to be seen. Eyeballing it would imply somewhere in between. The math implies something similar. The reality remains to be seen with what happens in the critical next couple of weeks as the incubation window vs. social isolation window overlap winds down.

When I started doing these daily charts, which seems like years ago, but it’s actually only been a couple of weeks, my intention was to provide an apples-to-apples comparison of how we were doing vs. other countries, especially the US. We were roughly 10 days behind them, and they were roughly 10 days behind Italy. And I threw in South Korea so we’d have a good target to aim towards. There were the original little charts showing each country independently, to illustrate what their curves looked like, and the consolidated chart of all of those on top of each other at the same scale. And then I added B.C. because it’s behaving a little differently than the rest of Canada, and most of the people reading this (including me) live there.

I am not going remove any of that, because they’re still interesting to look at, especially if you’ve been following it from the start, but the scale of the numbers and the squashing effect renders the visuals less useful than before. You can zoom in and definitely see the red line detaching from the blue one. You can definitely see the yellow line detaching from the red one. But as time goes on, it’ll just turn into a thick purple line.

Which leads us to the new graph I added today, one you’ve likely seen elsewhere… a logarithmic representation. This one is a little cleaner because it only has my 5 data lines…. and 4 dotted-dash lines, which refer to a topic I brought up yesterday, and have everything to do with the rate of acceleration — the Time To Double. The steepest of those lines, the smallest dots, is a TTD of 2 days. The next one over, that the Canada line is riding and now hopefully falling off of, is a TTD of 3. Below those are TTDs of 5 and 10.

There is no magic number as to what’s good… the bigger the TTD, the better. The more manageable things are. The less the avalanche of cases.

Fun fact… do you remember in school, where some of you hated math, and argued with the teacher that you’d never in a million years need this in the real world… well, haha, guess what, what we’ve been talking about here is differential calculus, and the acceleration we’re looking at is the first-order derivative of these graphs and their data. And the rate of change of that acceleration is the second-order derivative.

Hey, sit down — I promised, no formulas. There’s no test. But… now you have some understanding at what it is the experts are looking at closely, and, in many cases… worryingly… the rate of change of the acceleration. And its implications with respect to time to double, and the planning and contingencies that needs to be in place for those different scenarios. When they talk about flattening the curve, this is the graph to which they’re referring. And in a perfect world, all of those lines start flattening-out to the right. I’d much rather be writing about rates of deceleration.

One day…. hopefully sooner than later.

View Original Post and All Comments on Facebook

Day 13 – March 29, 2020

Today’s update will be brief… because B.C. doesn’t update numbers on Sunday, so anything I post is incomplete and/or speculative. Just for fun, I’ll do just that… we do have numbers for Ontario and Quebec (as well as a few, much smaller numbers from other provinces), so I am going to make an educated guess about how many new cases B.C. had today, fill it in with all sorts of warnings that this is pure speculation based on math, and we will retrofit and adjust things tomorrow when the official numbers are announced.

Given recent trends, I’m going to assume 105 new cases today, bringing B.C.’s total to 989, and adjusting that to the national total, 6,385 total cases in Canada. Which, might I add, if accurate, would make it a pretty good day all around. But I won’t comment on any of it until we have some real numbers; more on that below.

But while I’m here, let’s talk about recent numbers and recent trends. Not counting today’s guesswork.

The “how often is it doubling” question is being thrown around a lot, in many different contexts. Let’s call it Time To Double (ttd). Since I am dealing primarily with new cases, I will focus on that.

The higher the exponential growth, the quicker the ttd. I’ve included a little chart below the graphs that shows the ttd with relation to the percentage growth. The cells highlighted in yellow show the crossover point where the number has doubled. In this example, how long does it take to double a 10 to a 20?

For 10%, it doubles somewhere between the 8th and 9th day.
For 25%, somewhere between the 4th and 5th day.
For 40%, it’s somewhere between day 2 and day 3.

[I've edited this post and removed some numbers — I'm not comfortable making projections based on guesses. Real numbers come out on Monday and I will provide more (accurate) detail.]

As I keep saying, we’re in the middle of this grey zone where the social isolation number hasn’t caught up to the incubation period number. Provincially and nationally. Every day we don’t see a huge spike is one day closer the bottom of the big rollercoaster drop I mentioned yesterday. But without real numbers, I think we’ll leave it at that for now… suffice it so say, we’re at a critical point here in Canada. It could go either way. Stay tuned. And stay home. I’ll have more to say about ttd and its implications in the coming days.

View Original Post and All Comments on Facebook

Go to Top