

No B.C. numbers today, but here’s a brief look elsewhere…
Parts of Ontario (Toronto and Peel) are in a lockdown of the sort we saw around here at the start of this pandemic. Very tight constraints with respect to with whom you can get together, and strict rules around what that needs to look like. Everything else is pretty-much closed, except the essentials.
Saskatchewan saw a huge increase in numbers today, something they saw coming; measures were put in last week, but they’re now dealing with the effects of what came before. As we know, it can take a couple of weeks to realize the effects of these measures.
Alberta also set its record for new cases in the last 24 hours.
Today’s lesson in exponential growth comes from Nunavut… where, for the longest time (like till November), they’d seen zero cases. They got their first one Nov. 6th… their second one Nov. 7th… and then two more Nov. 8th. Then 8, 18, 26, 60… and they’re now over 100. Their graph is not a gentle slope or a hockey stick… it’s a literal cliff wall which they slammed into, after 7 months of flat road. That’s how this thing can take off.
In the spring, it was all about flattening the curve. For those late to the game, like Nunavut and Saskatchewan, where they never got a first wave, that’s where they’re at.
For places like Ontario and Quebec, it’s not just about flattening the potential frightening growth… it’s that the numbers, as flat as they may be (which they’re not) are already really big.
What’s worse… if you have 100 hospital beds available… to see cases go from 2 to 8 to 20 to 50 in a few days? Or to see them go 98, 99, 103, 98?
The answer is… it depends… on what measures are in place. Drastic measures are needed in example A, but example B is just as frantic, because it’s evidence of a problem that’s stressing the limits and that’s not going away unless something is done about it. Roughly speaking, example A is Nunavut and example B is Ontario.
The rate of growth is interesting to look at, on an apples-to-apples basis. I’ve added Time To Double (TTD) lines to the provincial graphs, and I’ve set them all (for now) to 20 and 25, so you can compare the data against those straight lines… and across provinces. Don’t worry too much about where those lines cross, just look at the slope of the data compared to the TTD lines. B.C. and Alberta are examples of consistent growth… you can see the recent growth is virtually parallel to the TTDs of 25. And at their steepest recent points, both Saskatchewan and Manitoba had recent TTDs approaching 10.
You’ll notice that Quebec and Ontario are a lot flatter. Indeed, their TTDs are 50 and 77 respectively. Their issue isn’t so much exponential growth… it’s just that any growth is already putting pressure on a system that at some point won’t be able to handle it.
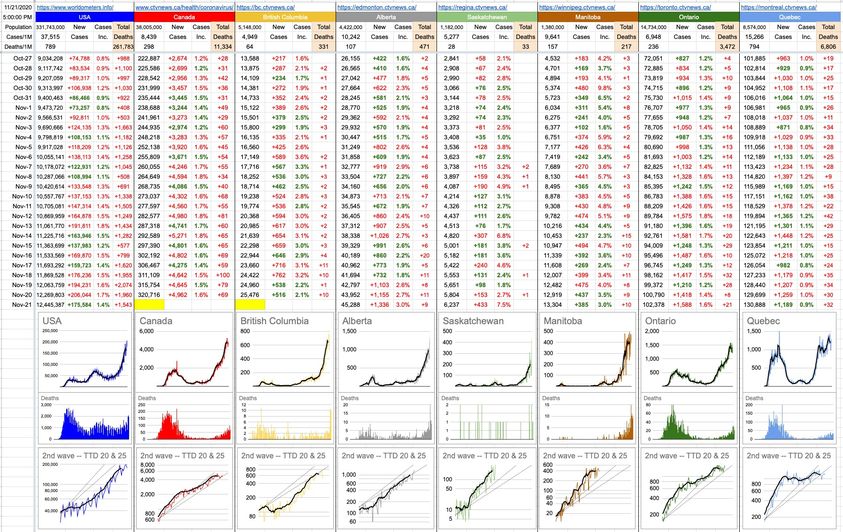
The nature of exponential curves mean if more than half your beds are full, you have a massive problem.
In Manitoba we never really had a first wave so people weren’t really taking it seriously
And AB ICUs are running now at 90% capacity.
But at least 45 is now well into Washington Generals territory after losing PA today in court, going to a less than ideal 1-33 in court when planning a coup.
p.s. 250 posts as of today 🙂