


Day 15 – March 31, 2020
You know that feeling you used to get back in school, when the teacher was handing back tests? The anticipation/dread… moments away from finding out how you did. Maybe you should’ve studied a bit more. Maybe you knew the material, but dammit… you froze, and blew it. Maybe you did ok, but almost certainly you made some stupid mistake.
That 5-second rush of emotion as she calls your name or just drops the marked test onto your desk… just before you flip it over to reveal your grade… that’s the feeling I get every single day when Dr. Bonnie Henry steps up to the mic to begin her update.
I find myself rooting for what I know would be good numbers. I know my charts and I know the math. I know exactly what number indicates the tipping point between this being a green day or a red day… and I find myself thinking the same thing I’d be cheering if I’d just bet zero on a roulette wheel… come on green. Come on.
Today was most certainly a green day, but, as usual, we’re still in this grey zone. Dr. Henry, intelligently, never leans past cautious optimism, and keeps talking about how “we’re two to fours weeks away from knowing”. and “this is a critical juncture”.
There are two parts to that.
Keeping in mind that we’ve been locked-down longer than a week, and that the incubation period is at most 14 days, we’re less than a week away from knowing what that particular impact has looked like. All indications with respect to that are optimistic. There’s no doubt our numbers in this province are trending favourably. For now.
BUT… there are people who will have gotten sick after that cut-off. And the people they’ve infected. And people who’ve arrived since the cut-off, and the people they’ve infected. And the people who are simply not following physical-distancing guidelines, etc. It takes a while for all of that to work its way through.
Along with that comes a serious reality check which is now being brought to light… that if this whole lock-down thing is the right way to do things (and it certainly is), we need to be prepared to do it for quite a while. At least in B.C., there’s zero chance of any of these standing orders being modified before the end of April, but it’s likely to be a lot longer.
Looking at the rest of Canada… there are some possibly-concerning numbers coming out of Quebec, but what’s interesting is that overall, the country’s numbers are doing reasonably well. I’m not close enough to what’s going on in Ontario and Quebec to say anything intelligent about it, other than to point out that Ontario has twice as many cases as B.C.. and Quebec has twice as many as that. Those combined ON/QC numbers are going to strongly influence the national numbers. Kind of like a federal election. Out east, they’re on their own “lock-down period vs. incubation period” countdown, so let’s wait till they’re clear of that before we start making assumptions. There’s green in that column too.
View Original Post and All Comments on Facebook
Day 14 – March 30, 2020
In Stephen Hawking’s remarkable book “A Brief History of Time”, he mentions in the introduction that he was advised that each formula he put in the book would halve the sales. Zero formulas, one million sales. One formula, half a million sales. Two formulas, a quarter-million sales. And so on.
By the way, that is exponential growth (well, decay, in that case). Which is what I’m going to talk about, but it’s also why I will try to include as few formulas as possible. Let’s stick to what’s important. Like, driving a car. Gas pedal, go. Brake pedal, stop. Steer where you want to go. That’s basically it, and you don’t need to understand the magic taking place under the hood to make good use of the car.
So, speaking of cars… let’s say you’re in your car, and you want to go from 0 to 100 km/h. My first car did that in about 18 seconds. My current car does it in 2.9. Both of those numbers are insane, but for completely different reasons.
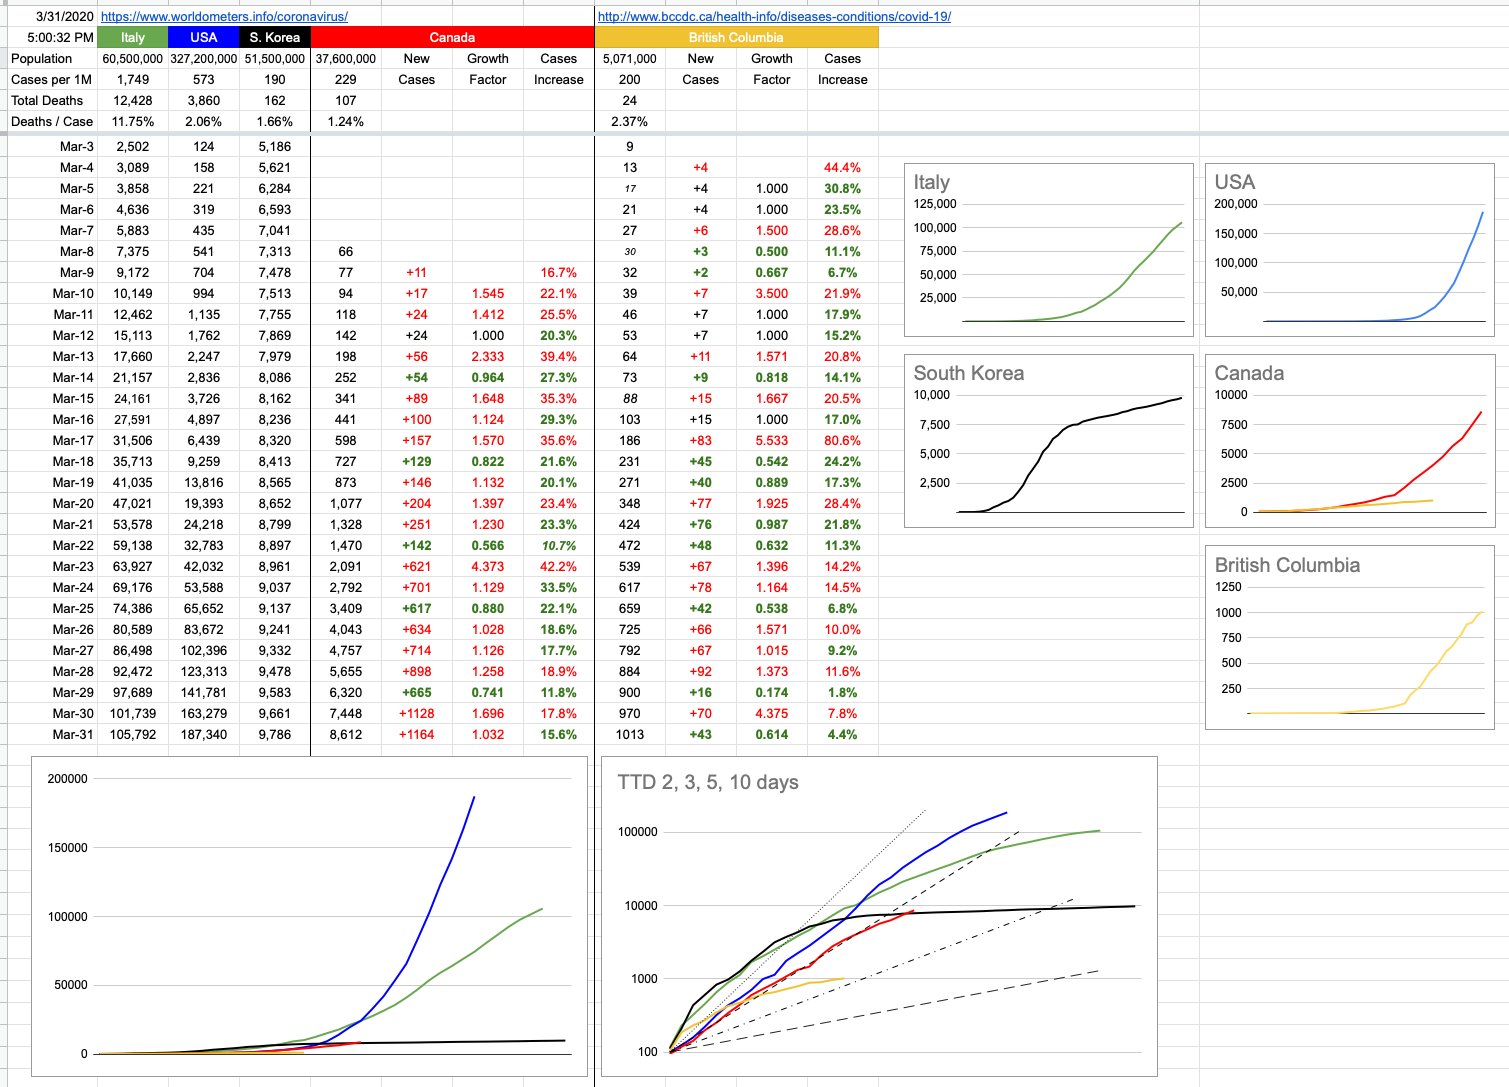
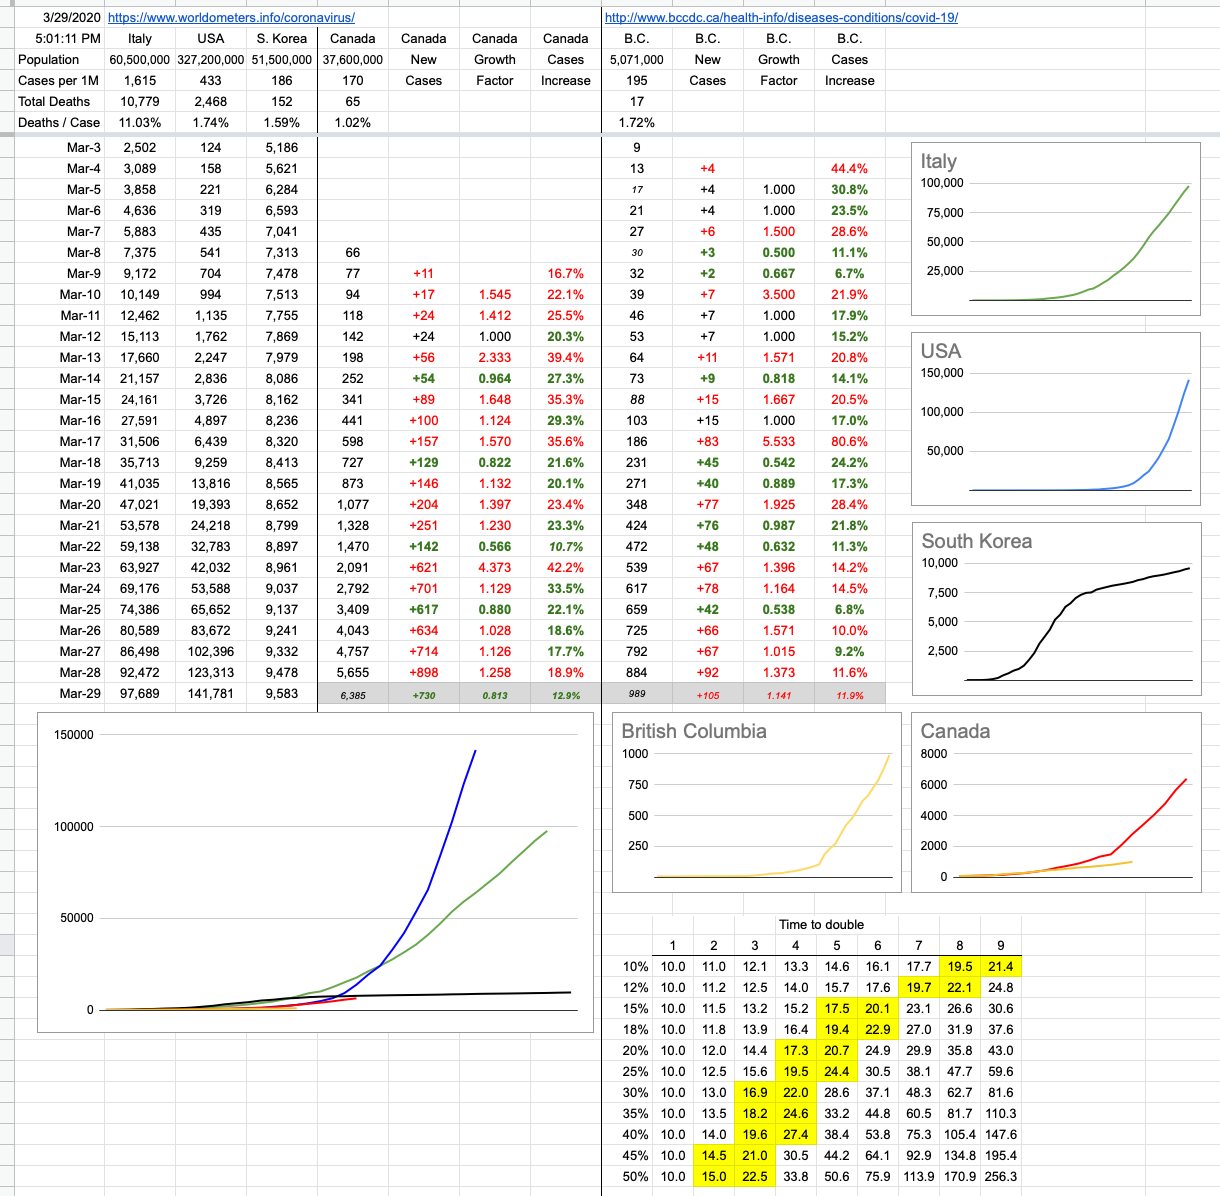
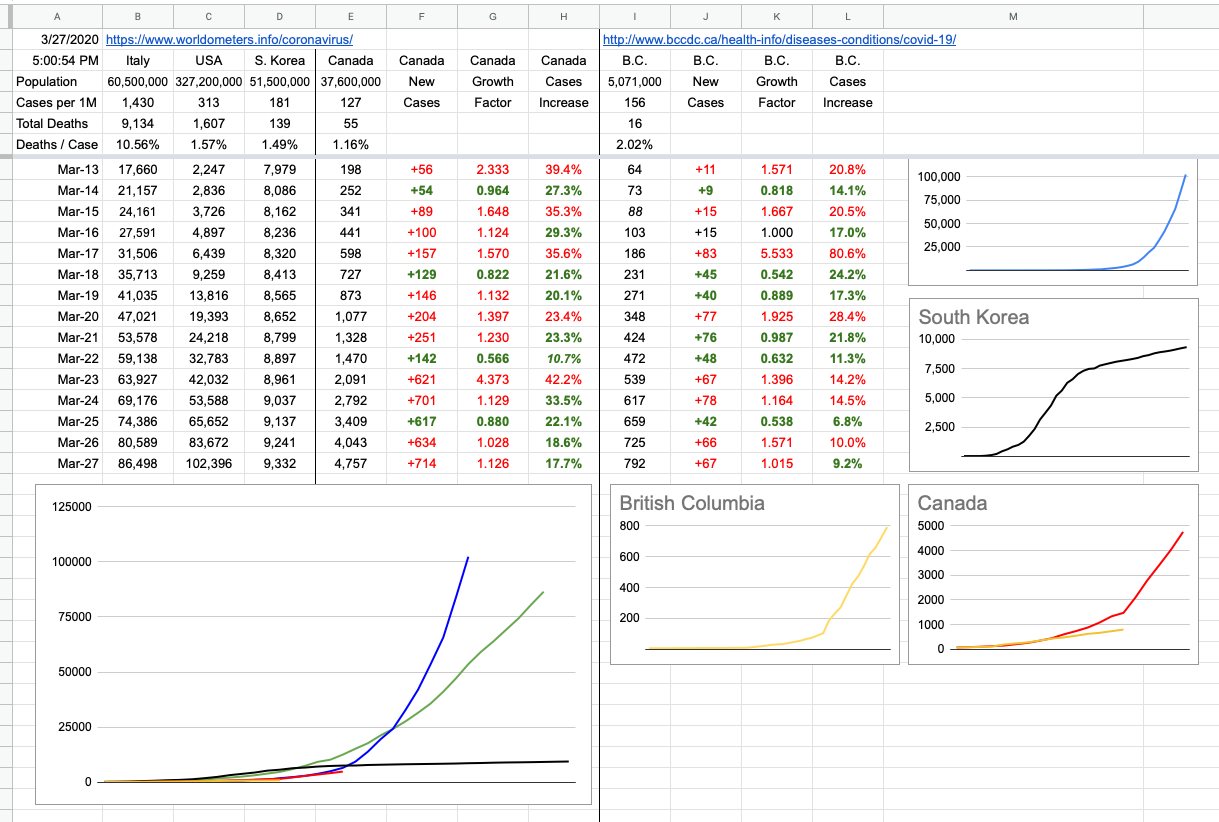
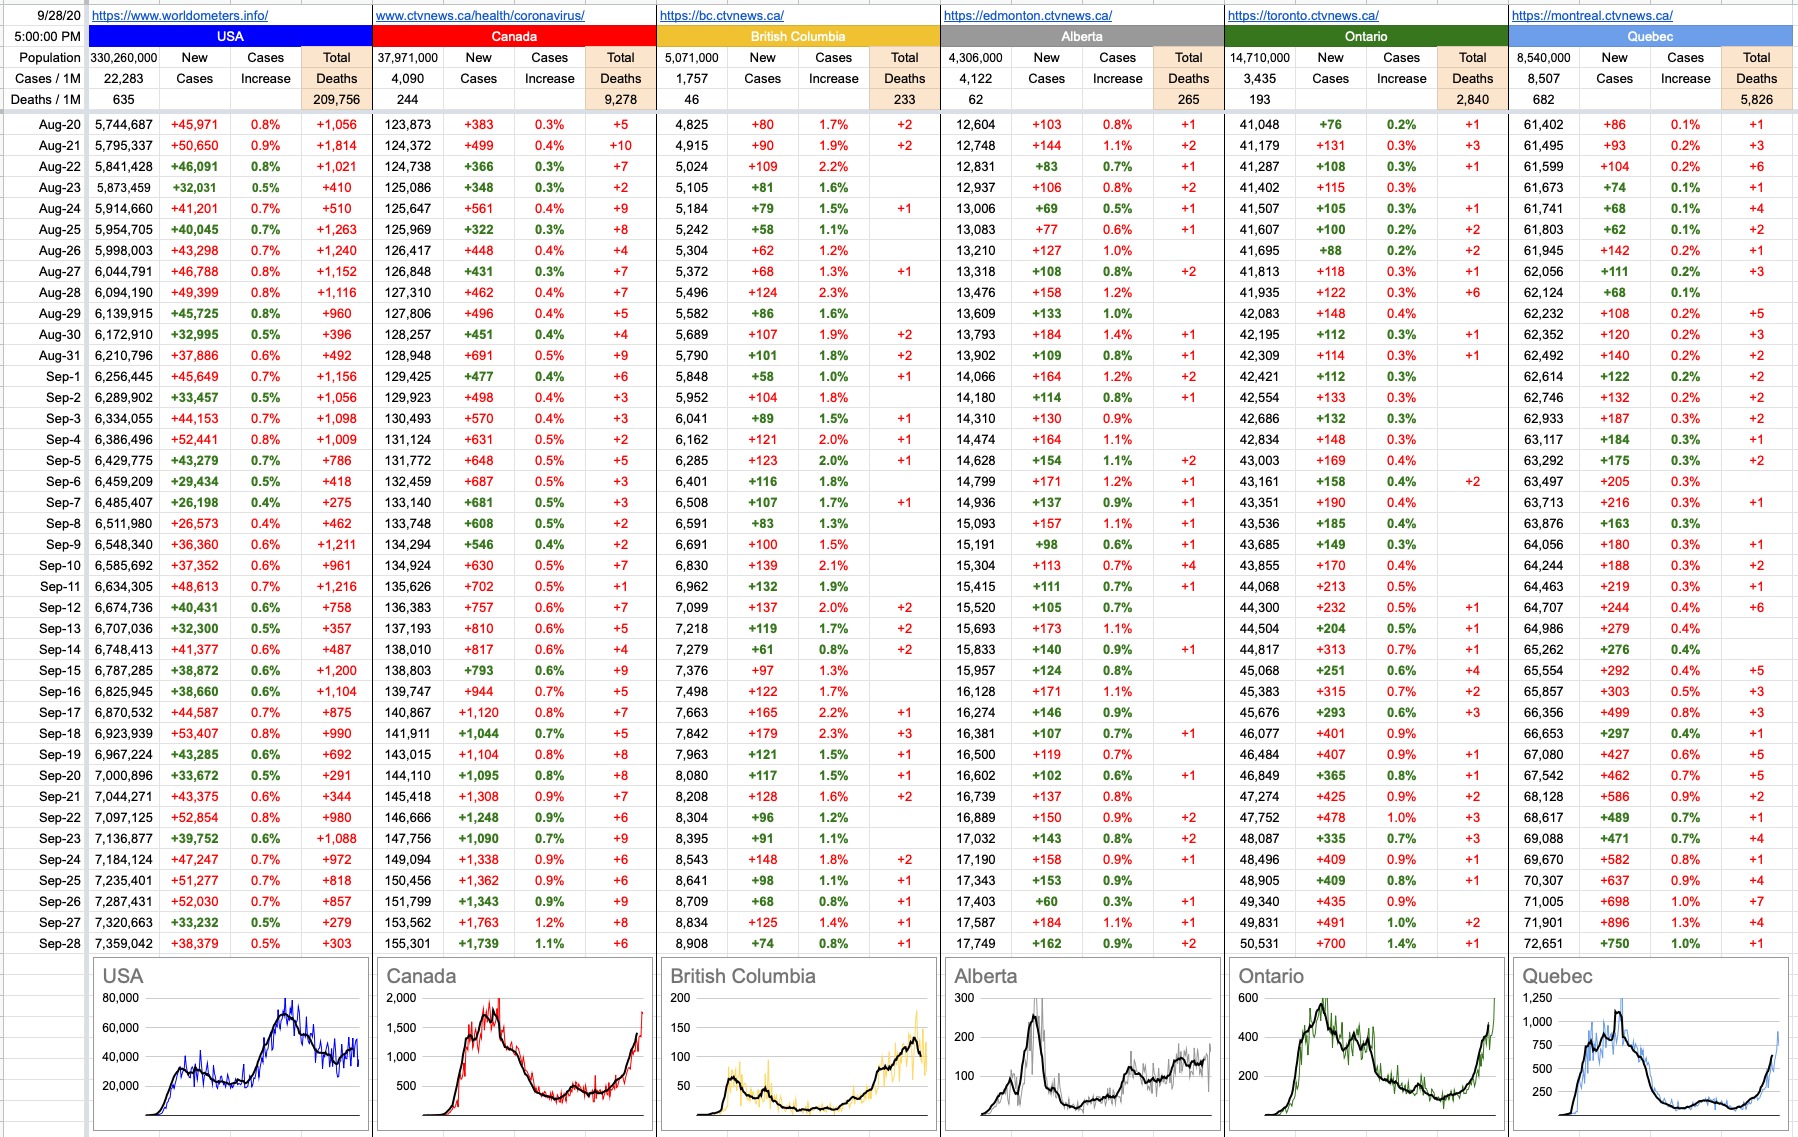
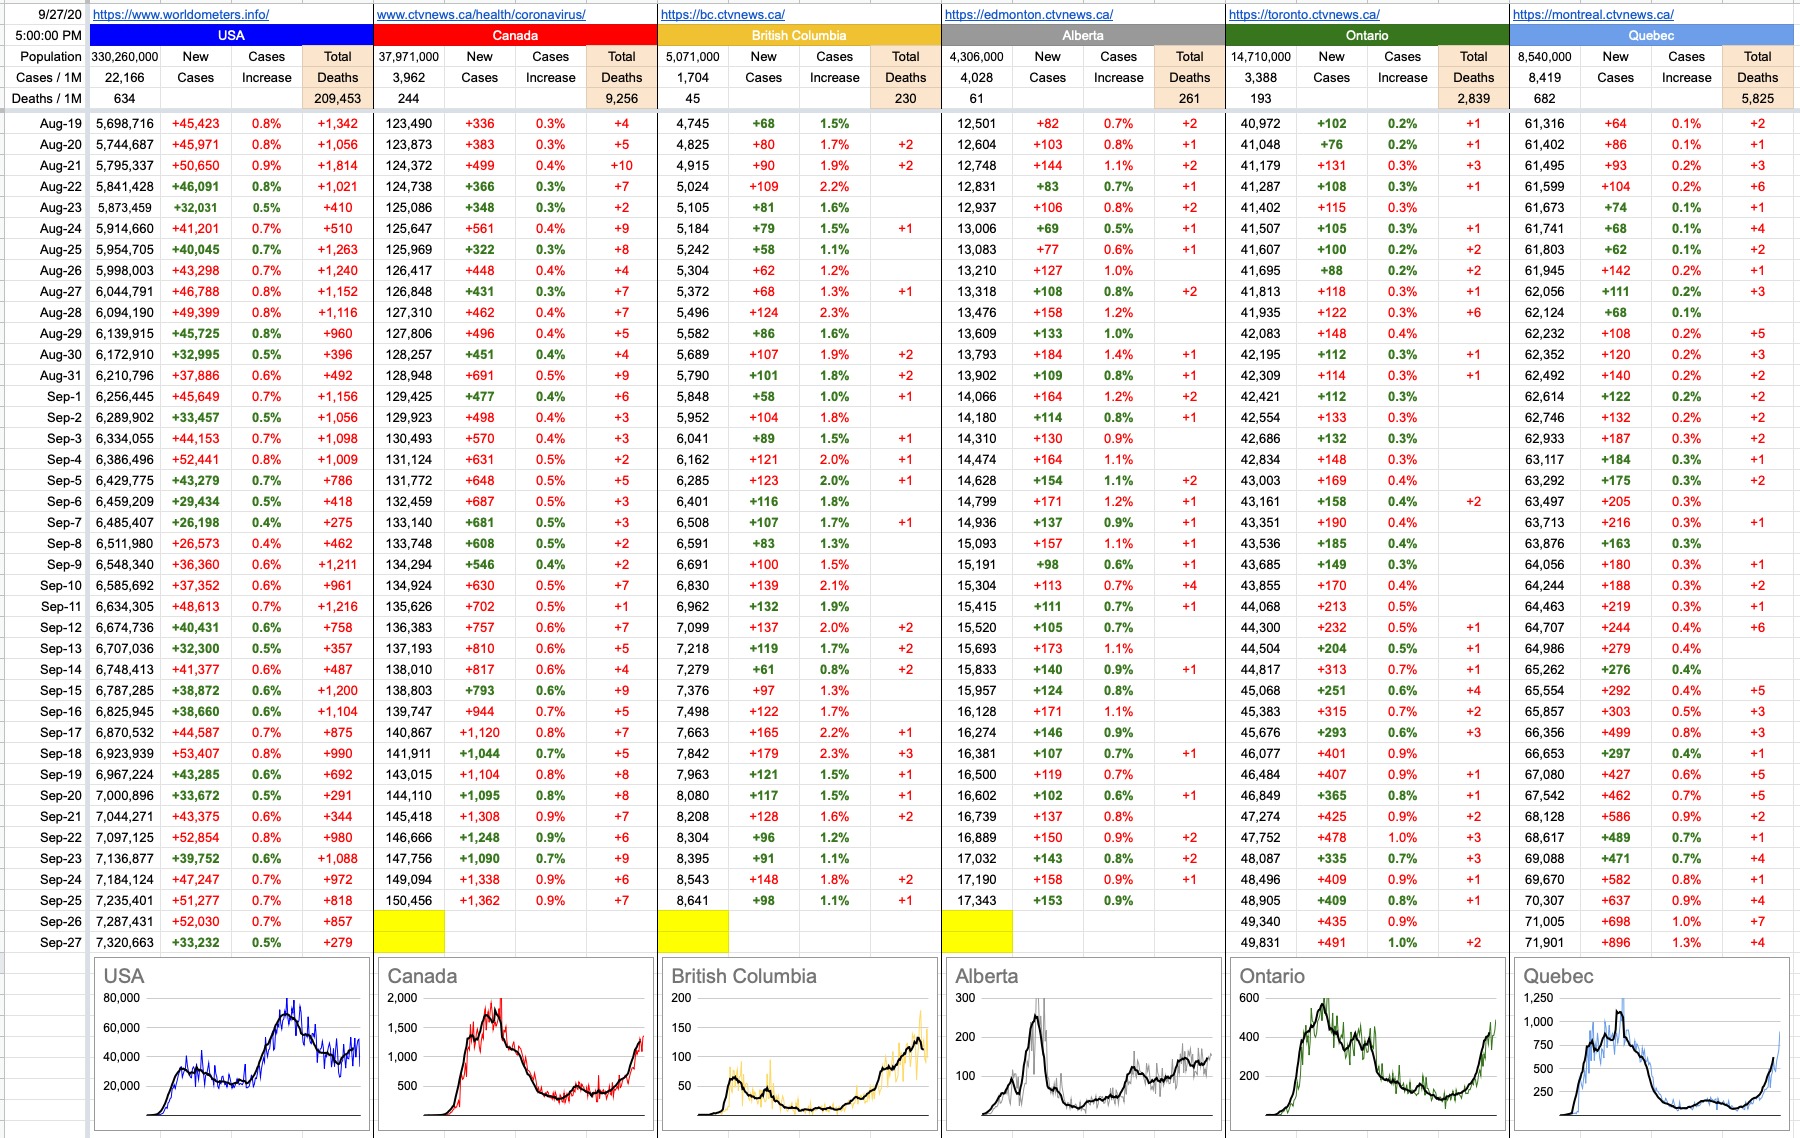
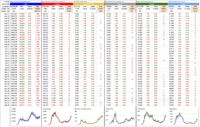
Let’s look at the new chart I’ve added, which is a logarithmic graph of all the same data… and some dotted-dashed lines I’ll explain below.
You car will follow an acceleration curve, which… interestingly, for a supercar like a Ferrari, will look a lot like the Italian line on the logarithmic chart. A more modest car, like a Kia, will look more like the South Korea line.
Ooohhh, wait a minute, we might be onto something here…
All cars eventually hit a top speed where they are no longer accelerating, and when they do, like the Kia/South Korea line almost has, it flattens out to a near-zero slope. That Ferrari/Italy line will flatten out too, eventually, but as we can see, at a much higher level, and it’s not there yet… but trending that way.
The Canada line has been skirting the left side of its attached dotted line, and is now a little on its right. What’s it most looking like? Thankfully, very evidently, not the MegaSupercharged Corvette/US line, whose pedal is still floored and heading to a scary top speed. Whether Canada trends more like South Korea or Italy depends to be seen. Eyeballing it would imply somewhere in between. The math implies something similar. The reality remains to be seen with what happens in the critical next couple of weeks as the incubation window vs. social isolation window overlap winds down.
When I started doing these daily charts, which seems like years ago, but it’s actually only been a couple of weeks, my intention was to provide an apples-to-apples comparison of how we were doing vs. other countries, especially the US. We were roughly 10 days behind them, and they were roughly 10 days behind Italy. And I threw in South Korea so we’d have a good target to aim towards. There were the original little charts showing each country independently, to illustrate what their curves looked like, and the consolidated chart of all of those on top of each other at the same scale. And then I added B.C. because it’s behaving a little differently than the rest of Canada, and most of the people reading this (including me) live there.
I am not going remove any of that, because they’re still interesting to look at, especially if you’ve been following it from the start, but the scale of the numbers and the squashing effect renders the visuals less useful than before. You can zoom in and definitely see the red line detaching from the blue one. You can definitely see the yellow line detaching from the red one. But as time goes on, it’ll just turn into a thick purple line.
Which leads us to the new graph I added today, one you’ve likely seen elsewhere… a logarithmic representation. This one is a little cleaner because it only has my 5 data lines…. and 4 dotted-dash lines, which refer to a topic I brought up yesterday, and have everything to do with the rate of acceleration — the Time To Double. The steepest of those lines, the smallest dots, is a TTD of 2 days. The next one over, that the Canada line is riding and now hopefully falling off of, is a TTD of 3. Below those are TTDs of 5 and 10.
There is no magic number as to what’s good… the bigger the TTD, the better. The more manageable things are. The less the avalanche of cases.
Fun fact… do you remember in school, where some of you hated math, and argued with the teacher that you’d never in a million years need this in the real world… well, haha, guess what, what we’ve been talking about here is differential calculus, and the acceleration we’re looking at is the first-order derivative of these graphs and their data. And the rate of change of that acceleration is the second-order derivative.
Hey, sit down — I promised, no formulas. There’s no test. But… now you have some understanding at what it is the experts are looking at closely, and, in many cases… worryingly… the rate of change of the acceleration. And its implications with respect to time to double, and the planning and contingencies that needs to be in place for those different scenarios. When they talk about flattening the curve, this is the graph to which they’re referring. And in a perfect world, all of those lines start flattening-out to the right. I’d much rather be writing about rates of deceleration.
One day…. hopefully sooner than later.
View Original Post and All Comments on Facebook
Day 13 – March 29, 2020
Today’s update will be brief… because B.C. doesn’t update numbers on Sunday, so anything I post is incomplete and/or speculative. Just for fun, I’ll do just that… we do have numbers for Ontario and Quebec (as well as a few, much smaller numbers from other provinces), so I am going to make an educated guess about how many new cases B.C. had today, fill it in with all sorts of warnings that this is pure speculation based on math, and we will retrofit and adjust things tomorrow when the official numbers are announced.
Given recent trends, I’m going to assume 105 new cases today, bringing B.C.’s total to 989, and adjusting that to the national total, 6,385 total cases in Canada. Which, might I add, if accurate, would make it a pretty good day all around. But I won’t comment on any of it until we have some real numbers; more on that below.
But while I’m here, let’s talk about recent numbers and recent trends. Not counting today’s guesswork.
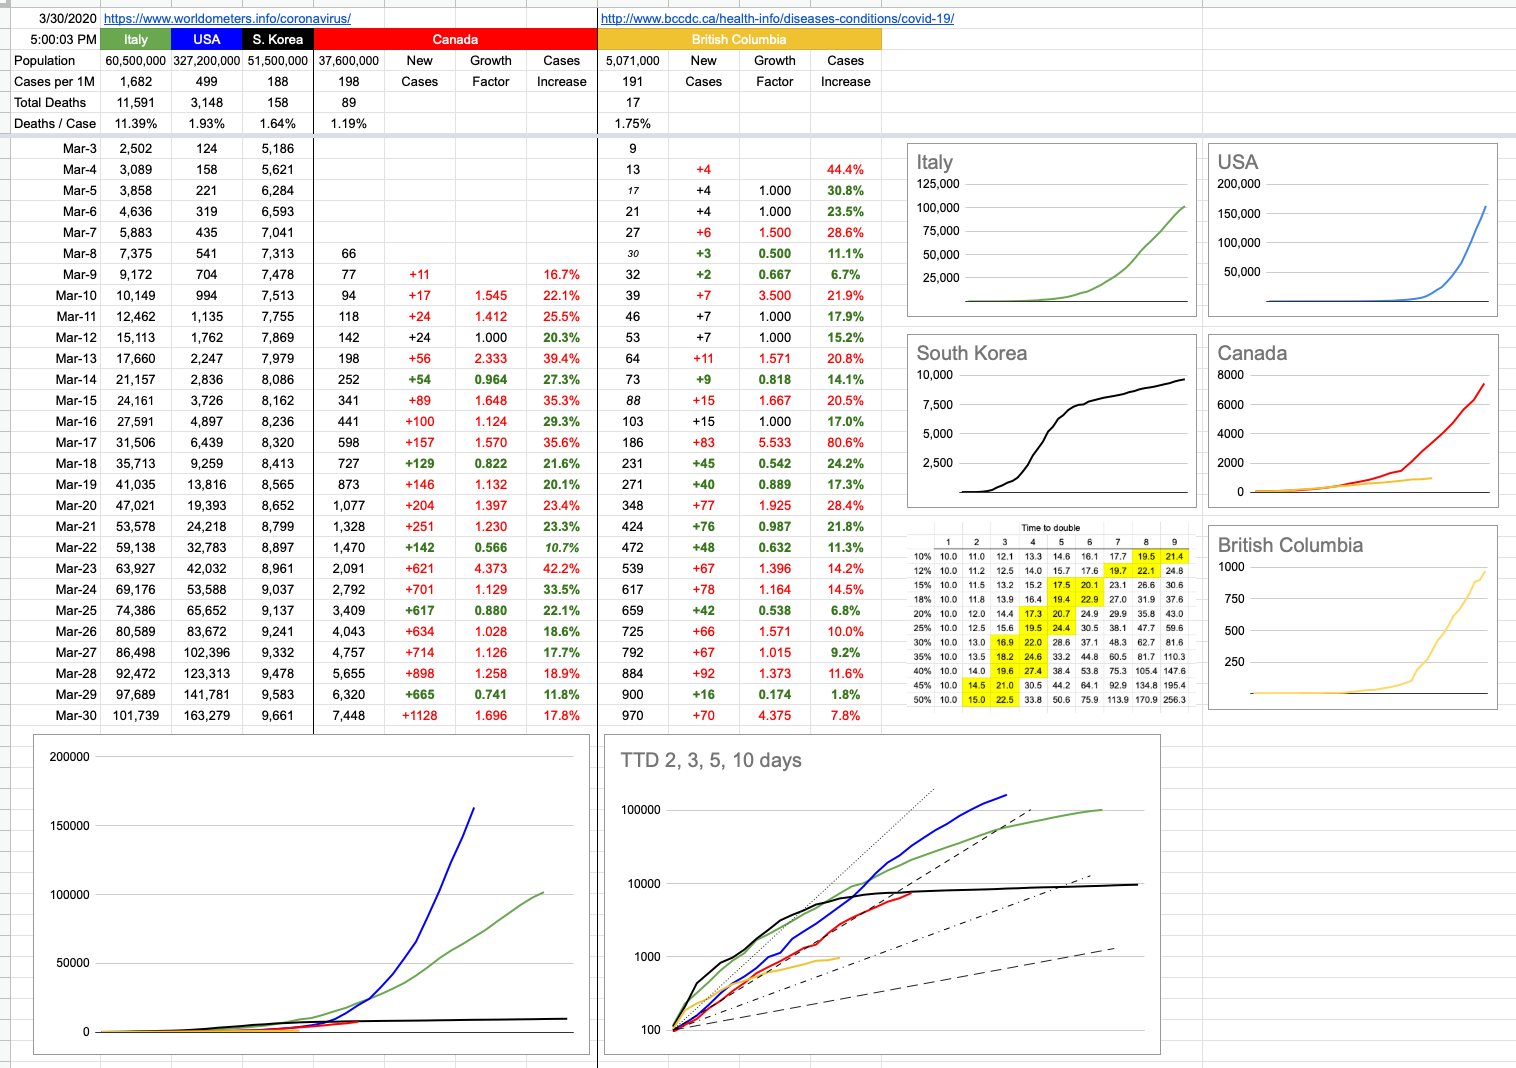
The “how often is it doubling” question is being thrown around a lot, in many different contexts. Let’s call it Time To Double (ttd). Since I am dealing primarily with new cases, I will focus on that.
The higher the exponential growth, the quicker the ttd. I’ve included a little chart below the graphs that shows the ttd with relation to the percentage growth. The cells highlighted in yellow show the crossover point where the number has doubled. In this example, how long does it take to double a 10 to a 20?
For 10%, it doubles somewhere between the 8th and 9th day.
For 25%, somewhere between the 4th and 5th day.
For 40%, it’s somewhere between day 2 and day 3.
[I've edited this post and removed some numbers — I'm not comfortable making projections based on guesses. Real numbers come out on Monday and I will provide more (accurate) detail.]
As I keep saying, we’re in the middle of this grey zone where the social isolation number hasn’t caught up to the incubation period number. Provincially and nationally. Every day we don’t see a huge spike is one day closer the bottom of the big rollercoaster drop I mentioned yesterday. But without real numbers, I think we’ll leave it at that for now… suffice it so say, we’re at a critical point here in Canada. It could go either way. Stay tuned. And stay home. I’ll have more to say about ttd and its implications in the coming days.
View Original Post and All Comments on Facebook
Day 12 – March 28, 2020
There’s that feeling you get when you sit down in a rollercoaster… first of all, what the hell am I doing, do I really need to be doing this… but once the thing starts moving, there’s no way out, so the impending dread as you start going up that first big hill… click-click-click as the chain underneath pulls the train slowly… wow, this thing is going a lot higher than I thought… click-click-click… this was such a stupid idea… click-click-click… ugh, this is a lot steeper than it looked… click- ohh.. no more clicks. We all know that means…
… and as the train gains momentum and sends you flying down that first huge drop, two things will come to mind… one, this part of it will thankfully be over soon and two, now you have a clear idea just how steep it was. Which serves to illustrate where we are today with respect to the numbers coming our way in the next little bit… there is a finish line to them, a week to ten days… and we once we hit that bottom, we will know exactly how steep things were.
Given where we are today and as per what I wrote yesterday, I don’t think we need to close our eyes and scream and hope for the best. It’s looking better than that. At least, on paper and at least, for now.
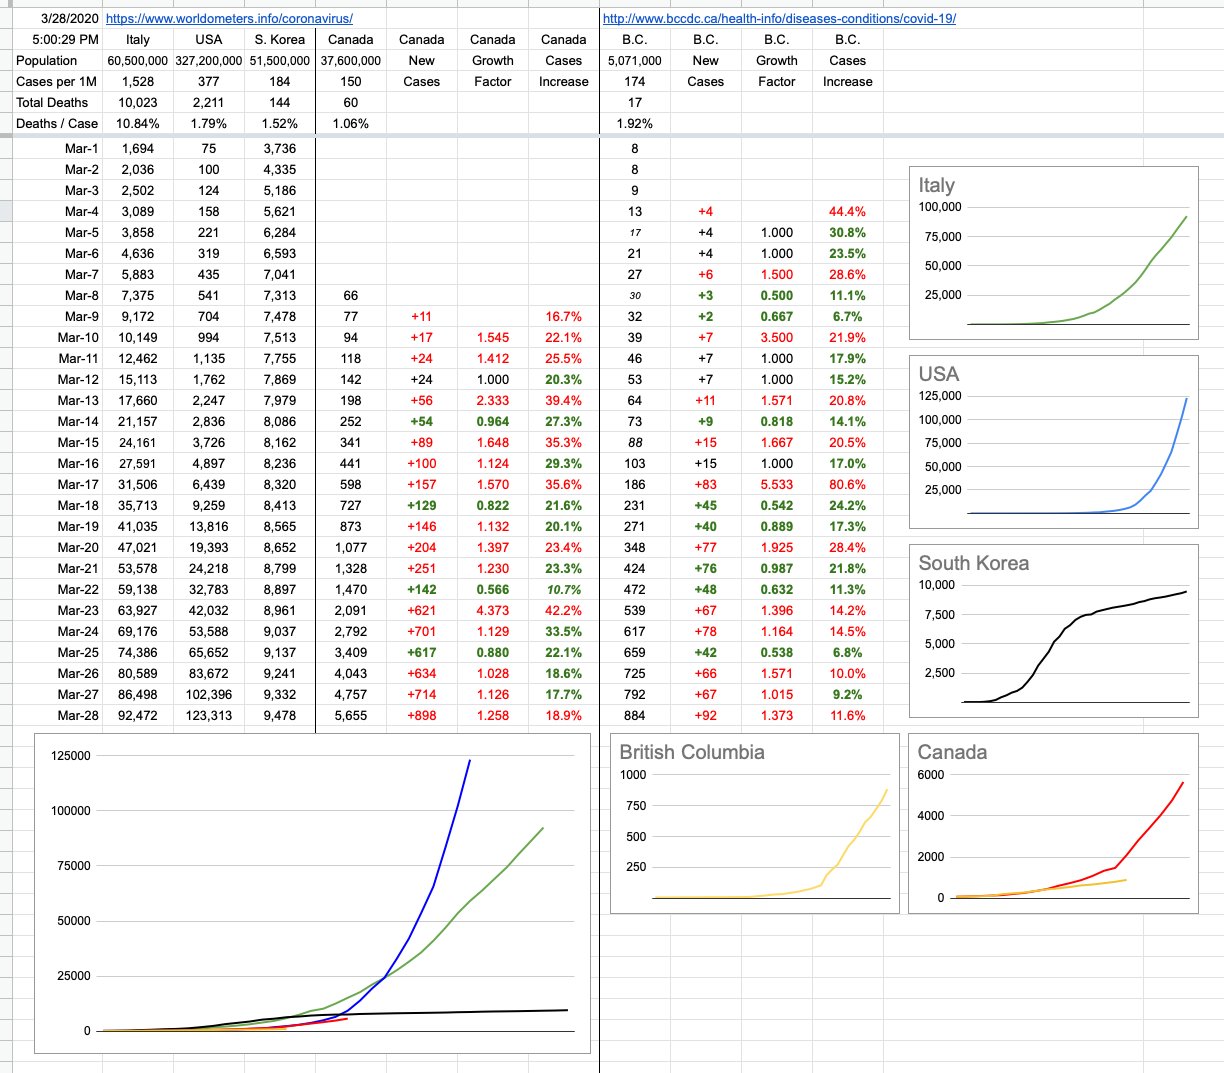
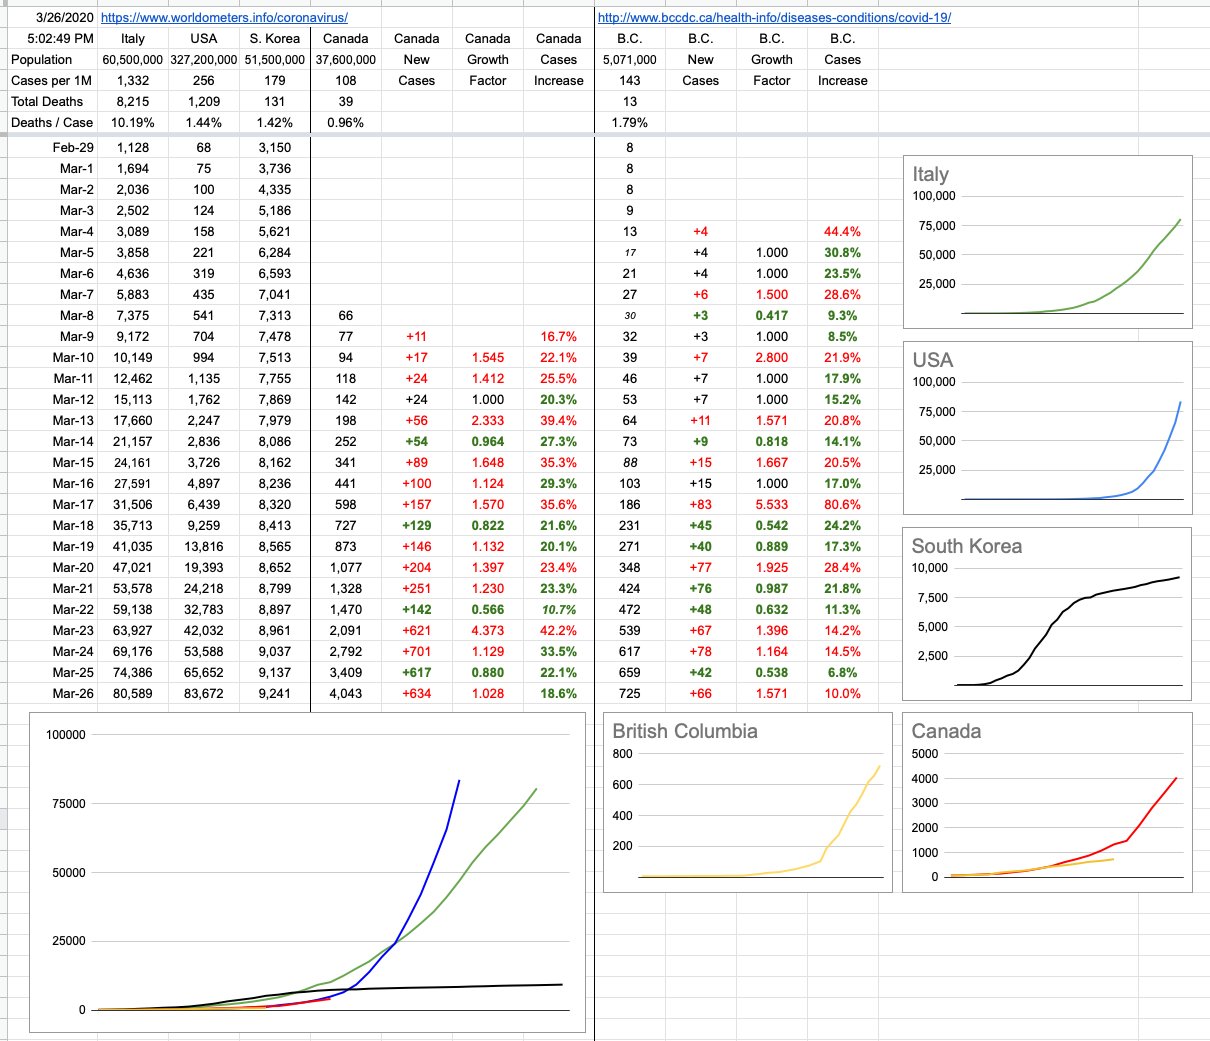
In B.C., although we had the largest one-day increase in cases yet, it’s perfectly in-line with our linear growth. Dr. Henry, for now, would like to see that number consistent at 12% which is roughly where it’s been. The average of the last 10 days is actually 11.1%. Today’s number was 11.6%. Yesterday was 9.2%. Nice solid straight yellow line, right in the sweet spot. And might I add, I am tracking total cases as they accumulate, not factoring in recoveries and deaths. The outcomes of these cases is a whole separate topic. But on that note, while we saw an increase of 92 new cases, we also saw 121 cases moved to the “recovered” column. As far as these numbers are concerned, today in B.C., there are less active cases than yesterday.
Canada’s number is bigger, but also consistent and also, slowly, hopefully, for now… going down day by day. Yes, of course the number of cases is increasing, but that rate of increase is itself decreasing. See that column… 4 out 5 days of green numbers. The rate of growth is slowing. For now. Are we still following the U.S. trajectory? Visually, and numerically, we’re not. Not so long ago, and you can still see it on the chart, Canada’s data was almost exactly perfectly 8 days behind the U.S: Feb 29, Mar 1, Mar 2… the U.S. had 68, 75 and 100 cases. 8 days later, Mar 8,9,10 — Canada had 66, 77, 94 cases. Perfect lockstep. And if you eyeball those numbers as you slowly go down the two columns, you see them in lockstep… and then they slowly start drifting apart.
The hope is that we wouldn’t follow them down the hellhole-course they’re presently on, and, for now, we’re not. We’re at 5,655 nationwide cases. 8 days ago, the U.S. was at 24,218. Had we “kept up”, today’s number would be 4x what it actually is. We’re now more than 11 days behind them.
So what does it all mean…
I’d like to address some of the comments that question the usefulness of these numbers in general, how the testing is inadequate, this isn’t reality, this is a useless exercise because the numbers are all bullshit. That the real case numbers are anywhere from 10x to 50x and it’s anyone’s guess. And therefore, blahblahbblah.
So, first of all, the way to solve big problems is to break them in half. Solve each half independently, and once you do, the big problem is solved. And if one or both of those halves is too complicated to solve, break it in half again and solve that. Keep breaking it in half until you have manageable pieces to solve.
The enormity of our present situation requires breaking it into hundreds of pieces, but here are some of the big ones, each of which needs to be broken down into many smaller pieces:
– the actual number of cases out there, factoring in recoveries
– the actual number of cases that require hospitalization
– why are some demographics hit so differently than others
– the testing infrastructure, and the strategy and adequacy of it
– the ability of our medical infrastructure to handle the cases
– the actual number of people dying from this
– the economic implications of allowing this to go on too long
– the herd immunity thing
– the treatment options, effectiveness of therapies, and timelines
– when and where is the vaccine
Without tackling all of that, notwithstanding each of those topics is its own book, and that’s only a small snippet of topics that need addressing, where we’re at right now is trying to solve chunks of a problem with incomplete information. One thing we have to our great advantage is learning from what others have or haven’t done ahead of us. Like one big change that was implemented today here is that the number of patients on ventilators doubled. Because suddenly a lot more people got a lot more sick? No. Because we learned from data elsewhere that putting people on ventilators sooner has a huge impact on positive outcomes. We didn’t know that two days ago, and now we do, and now we use it to our advantage.
Just because we don’t know something is no reason to throw our hands in the air — “these numbers are all crap anyway” — but to tackle this particular aspect…
Knowing the actual number of cases out there would have a profound effect on many aspects… first of all, how many actual new cases are there each day… how many of them will the person never even know, how many will they get sick but not too sick, how many will need a hospital, how many will die. If we could snap our fingers and know all that, it’d be great. One school of thinking that might kick in is that if actually the number is not 10x or 50x but actually 500x, and many of us have had it and never even knew it, and now we’re immune and will be for several months and even if we’re not, who cares, clearly I can fight this thing off so let me get a little sick and impose my herd immunity and get back to work since the actual mortality rate is only 0.2% etc.
Don’t think everyone has their heads stuck in the sand thinking the published numbers are the extent of this. One day, in hindsight, we’ll know those numbers. It’s possible that one day, we will have instant, cheap and available tiny-traces antibody testing. You’ll be able to wander into Starbucks, and along with your chai latte, spit into some throw-away little thing that’ll turn red if you’ve had it, stay blue if you haven’t. But until we get to that point, to a great extent, all we’re doing is buying time. Flattening the curve to suppress the load on our medical infrastructure. Isolating ourselves so we don’t infect others, especially those who are much likelier to get lethally ill. Keeping this thing controlled and contained until we’re certain we can manage it. It’ll likely never go away, and the waves of it appearing in the future will hopefully wind up in the “no big deal” pile.
But for now, the published numbers, the important numbers… the ones that are putting load on our medical system… the 884 confirmed, the thousands of others likely presumed but not confirmed… don’t think they don’t know about it. Don’t think when they tell you to stay home for 14 days, pay attention to your symptoms but don’t come in — that they’re not tracking you. You, who may well have it who think you don’t count — trust me, you do. Not in my numbers, not in their published active-cases numbers, but you’re out there somewhere, included in all of the projections of what might happen and how they’re going to take care of you if you get really sick. Some of you think you have it, but don’t. Some of you have it and don’t know it. Neither of you got tested, so hey what the hell they don’t know what they’re doing this is bullshit… yeah, no. Not at all. They’re not going to waste a test to confirm a mild test. There’s an N% chance you have it, depending on your age and other risk factors. Take care of yourself with the provided guidelines, and you’ll most likely be ok. And if you’re not, critical care awaits you with open arms. As opposed to everyone who thinks they might have it coming in and overwhelming a system that, certainly at the moment, is not prepared to test 2 million people overnight. If you’ve had it, one day you’ll know.
The fact that our hospitals are not overrun… the fact that we’re prepared at present to handle anything but the absolutely worst-case scenario… the fact that were are notably flattening our curve, both provincially and nationally… and the fact that we’re doing that with incomplete information, tackling big, multi-faceted problems… don’t worry too much about absolute numbers and how you feel they don’t reflect reality. They’re serving us well.
Speaking of serving us well, please take a moment to step outside at 7pm tonight (and every night) to cheer the heroes of this nightmare — hope you never need their help, but the army of medical workers of this province and this country, and indeed, around the world… deserve to (loudly) hear our gratitude and appreciation.
None of us like this. They don’t. You don’t. I don’t. But let’s remember… as hellish as it may be, the rollercoaster ride eventually ends.
View Original Post and All Comments on Facebook
Day 11 – March 27, 2020
To circle back a bit on something I said yesterday… with a bit more detail…
The incubation period of a virus (which is up to 14 days in this case) indicates the period of time where someone might be infected, but not show any symptoms. Some viruses can be contagious during that time… as is this one.
In B.C., we were told to go home (and stay home) sometime around March 16th — 11 days ago. It was a bit of a loosey-goosey following to begin with… but it tightened up a few days later… 19th or 20th. Let’s call it 8 days ago.
With an incubation period of max 14 days… and without a serious lockdown until 8 days ago, we have a trailing 6 days where we were all going about our daily business, feeling fine and possibly not too concerned about the possibility of either passing this off or getting this from — someone else. Unfortunately, during that time, both of those things could have happened.
Which means, at this moment, we have this big unknown for the next 6 days… where we might see a spike in cases. The degree of that spike remains to be seen. That’s the potentially bad news.
The potentially good news, however… is that not all cases take to the last minute to show up, so we can learn a bit about what’s happened so far. During these 8 to 11 days of isolation, cases have certainly shown up… and our (for the moment, and hopefully forever) very capable medical infrastructure has been dealing with them.
Also, every single case that developed during that time in (proper) isolation, infected, at most, the people isolated around them. Let’s say that person is isolated in a home with 2 others. The N went to, at most, 3N.
What would have happened if that person were wandering around, not isolated?
R0 (“R nought”) is the number assigned to describe on average how many people someone who’s infected is likely to themselves infect. COVID-19 seems to have a R0 of around 2.2.
So… that one person, instead of infecting just those closely around them, might be outside somewhere infecting 2 or 3 random people. And those people might each infect more people. And if that’s happening every few days, after 3 weeks, that’s repeated 7 times… and now there are 250 cases. All from that one person, if they, and everyone else below them, infected an average of 2.2 others.
That is exponential growth. That is that scary growing curve we’re seeing in many places, like the U.S. That is why you always try to pay-off your entire credit card. That is why you try to keep your money where it’s earning interest that’s compounding. That’s why you’d better know what you’re doing if you’re breeding rabbits. And that is why physical isolation is so ridiculously important… and, when done correctly, effective. One person can make a colossal difference.
Guess what — that one person may have been you, and you didn’t even know it because you never developed symptoms. But by being responsible and staying isolated and not passing it along to someone else… well, one or more of those 250 could have developed serious (even fatal) symptoms. But they didn’t, because you’re doing the right thing. You may actually have saved a life.
And a bit of further potentially good news… at least here in B.C., there is most definitely a flattening of that curve. The numbers are certainly growing, but the growth is linear, not exponential. Like that N that turned into 3N instead of 250N. It’s growing, but not as steeply as the scary scenarios. Including a spike of 83 new cases 11 days ago, the average increase in cases in B.C. during that time has been 63 daily. Today was 67. Yesterday was 66. That yellow line is so linear you can put a ruler to it. For now.
As for all of Canada… well, there’s a definite separation between us and the U.S. We have had 4 straight days of decreasing growth, on a percentage basis. For now, that national curve is also flattening, and gapping notably with the emerging disaster south of the border.
I find myself saying “for now” a lot, and it’s because we’re dealing with a lot of unknowns. Like what the next week may bring. But if you want to be cautiously optimistic, it would appear that just one week of physical isolation is having a very measurable, positive effect.
And if that is the case, now is the perfect time to not go out rejoicing in the streets. The thing to do is what you’re doing. Stay home. What else are you going to do, anyway… it’s rain for the next several days. Yay Vancouver weather!!
That’s it. It’s not too much to ask. You’re not being called to charge Vimy Ridge. You’re not being called to storm the beach at Normandy. You’re being called to sit on the couch and watch Netflix. I have all the faith in the world you’re up to the task.
View Original Post and All Comments on Facebook
Day 10 – March 26, 2020
Fun fact: Both South Korea and the U.S. reported their first case of COVID-19 on the same day: January 20. The present-day outcomes are so different that it’s worth understanding what they did (or didn’t), and where our approach, provincial and national, fits in.
The answers are long and complicated and will be discussed and argued for centuries, but it can all be distilled down to one brief and accurate summary: South Korea did a lot; the United States did not.
One thing South Korea did was test the hell out of this thing, as far and wide as they could. They developed and administered thousands of tests almost instantly — like a week — and were quick to isolate those that tested positive. The U.S.… didn’t. They stuck their heads in the sand for a bit, called it no big deal, and did little except stop incoming flights from China… but as far as I know, the COVID-19 virus is not a member of any particular frequent-flyer club. It doesn’t care what airline it flies, nor where the flight originated. Once it’s on the plane and headed somewhere, it’s landing and it’s sticking around.
It was initially thought that community transmission wasn’t a concern… the U.S. thought it, we in Canada (and here in B.C) thought the same; we will find cases, we will isolate them, the cases will resolve and it shouldn’t be a big deal. The risk to you and me is low. A month ago, there were only 7 cases in BC, and all of them could be traced to close contact.
South Korea’s initial jump of cases had a lot to do with their prolific testing, but what comes after is what’s worth noting. Their impressive flattening of their curve has everything to do with their reaction… isolate. And when it became apparent that community transmission was indeed happening, that’s the only reasonable course of action: Social/Physical distancing.
Since our testing hasn’t reached everyone, and since we don’t yet have antibody tests that would tell us who’s already had it, the only reasonable course of action is to pretend everyone has it, and act accordingly. Indeed, the way to think about it isn’t to assume everyone has it… and keep away. It’s to assume you have it, and take every precaution not to pass it along to anyone else.
We are being warned to expect a jump in numbers in the coming days, due to the difference between incubation times and how long it’s been since the directives were brought in. We may see a sharp increase in cases in the coming days… incubation period of 14 days minus 10 days of distancing equals 4 days where we were all potentially wandering around infecting each other. And as those infections kick in, the numbers will rise… possibly quite sharply.
It’s after that period of time that we should start seeing some real effects of what we’ve all collectively been doing. That black South Korea line is what we want. That blue American line, not so much.
On that note, and again, too early to tell… but here in B.C., our growth is, for now, linear. Good news… for now.
View Original Post and All Comments on Facebook
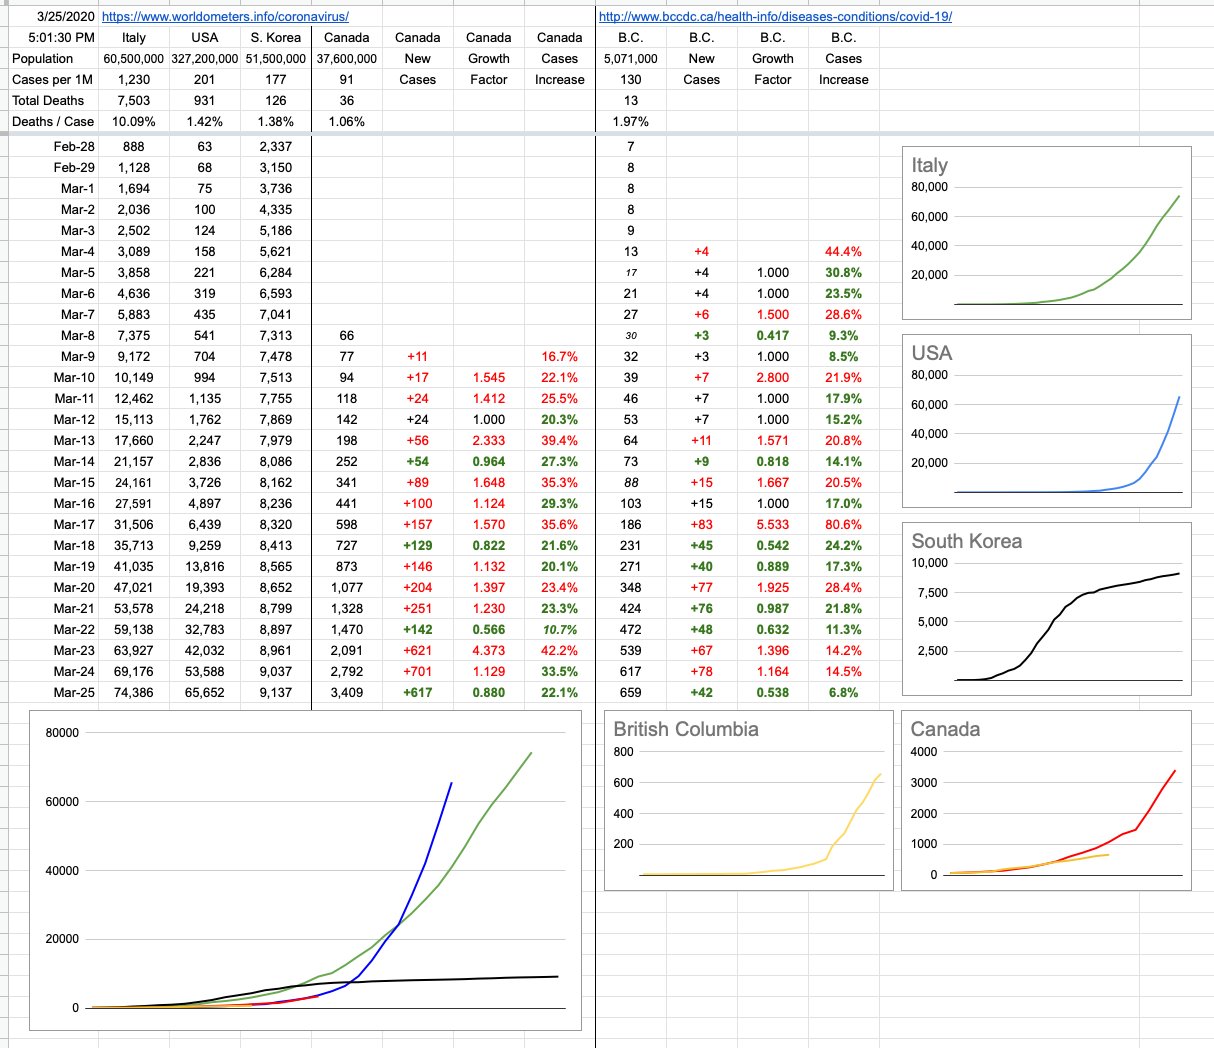
Day 9 – March 25, 2020
At some point, we are all having “one of those moments” these days… it can last a minute… or an hour… sometimes, all day. The first thing I do when I update these charts every day is to enter the date, and today, when I entered Mar-25, I had one of those moments.
Seeing that date reminded me… that in some non-pandemic-infested parallel universe somewhere, the Canucks are playing the Sharks tonight, and I have tickets to the game.
I was really looking forward to it… because it was bound to be an exciting game. This is exactly the time of year when we’re typically fighting for a playoff spot, and usually, it’s a situation like the Canucks have to beat the Sharks, but also, the Ducks have to beat the Flames. And it’d really help if the Avs could beat the Oilers, just in case we lose, because then, next game, yada yada…
All of that occurred to me because… wow, do I miss that. I would so much rather be doing that sort of math… than this.
But here we are, so let’s look at these numbers… and hope that one day soon, all of us can get back to the things that feel so incredibly far away right now.
And, for what it’s worth, today was a good day. BC had a good day, and Canada overall did as well.
That yellow BC line looks good… for now. That will change in the coming days, and Dr. Henry was asked about how many cases she thinks are out there, as opposed to just confirmed cases. She will discuss it Friday morning, with some detail on the modelling they’re using to arrive at these estimates. There is a big difference between confirmed cases and actual cases… how big remains to be seen. But at least today, around here, it was a sunny day in many respects.
View Original Post and All Comments on Facebook
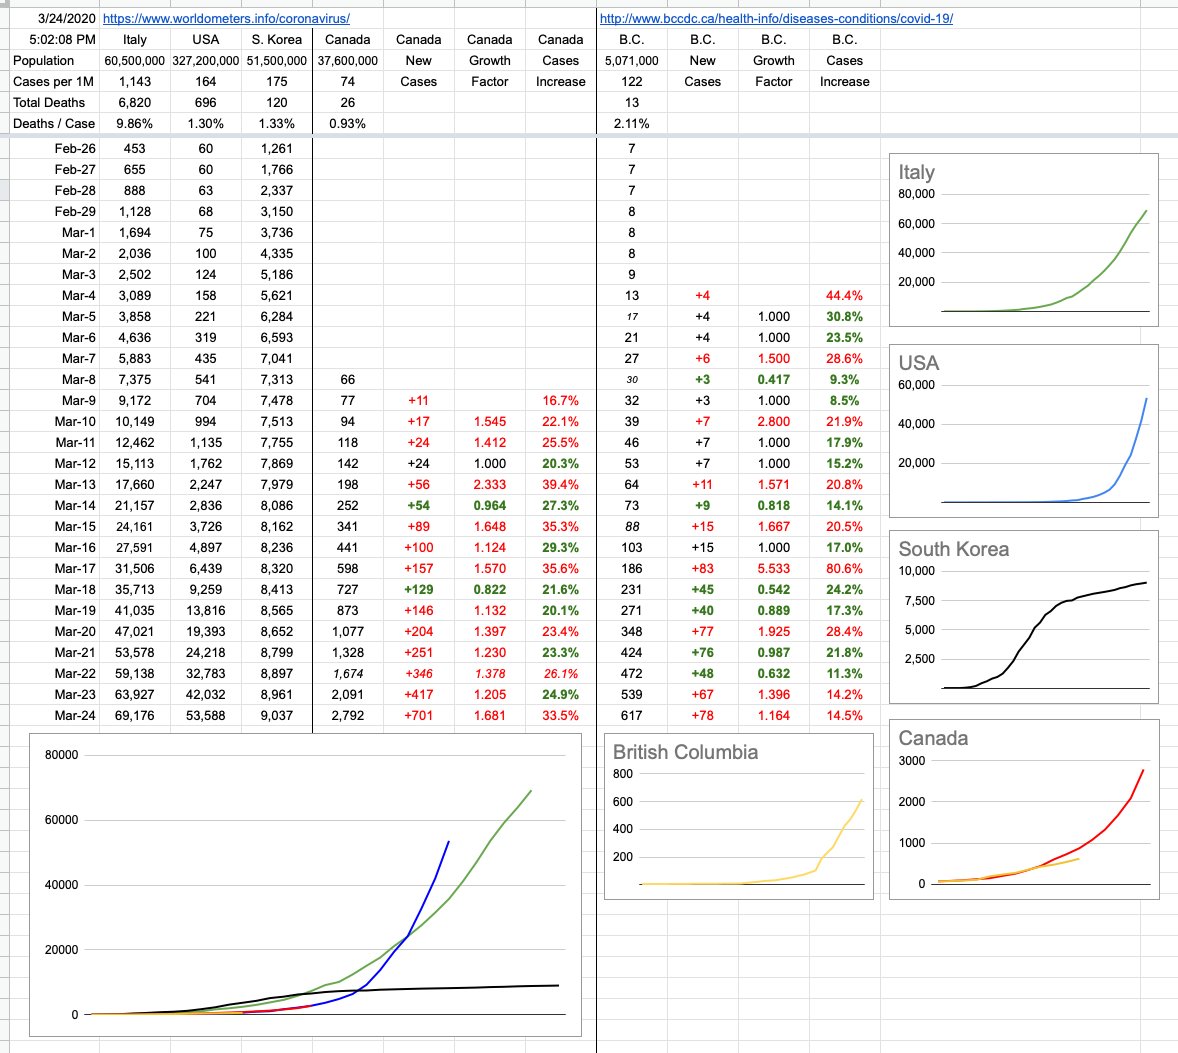
Day 8 – March 24, 2020
As is often the case with us here in BC, the Wild West of Canada, we’re not always in sync with the rest of the country… and since the majority of people reading this are in BC, I’ve added a whole new set of data and graph… which is us… British Columbia.
I haven’t been following closely other province’s responses. Nationally, yes. BC, yes. But I’m not sure when Ontario or Quebec locked things down, nor the manner in which they did it. The reason that’s relevant is that while we’re seeing some not-so-great numbers out of Quebec today, the last few days here in BC paint a better picture.
We’re still over a week away from seeing the direct impact of the social-distancing order, and numbers will indeed increase between now and then… but the manner in which they increase is important, and for the moment, at least around here, it looks pretty good. The growth is linear, not exponential. At least for now. It’s evident in the BC graph, and it’s very evident when compared to the rest of Canada, which overall continues to pretty accurately track where the US was 10 days ago.
View Original Post and All Comments on Facebook
Share...
September 29, 2020
Leona Helmsley was a wealthy hotelier, back in the 1980s. In discussing herself and her husband, she once famously said, “We don’t pay taxes; on the little people pay taxes.” Leona was ultimately sentenced to 16 years in prison for federal income tax evasion. And, as you may already know, Al Capone, guilty of every organized crime known to man (bootlegging, prostitution, racketeering, murder, etc.) was ultimately only charged and sentenced for one thing… income tax evasion… which landed him in prison for the rest of his life.
More recently, like a few months ago, I was staring at a math formula that I needed to plug into a spreadsheet. I needed the formula in terms of x, but unfortunately, x was an exponent in an expression that was under a square-root sign, and all of that was the numerator in a bigger expression. After staring at it for a minute, I asked my son, who was sitting nearby, if it he could figure it out… and he promptly did.
In hindsight, perhaps I could’ve paid him a consulting fee. What was that worth? Well, like the old joke… from the old “50 cents to push the button, and $999.50 to know which button to push” school-of-thought, $20 wouldn’t have been out of place. Even $100, since I needed it right away.
Wait… maybe I need a mathematician on payroll… I could hire him as a consultant on a monthly retainer. $1,000 a month? How about $10,000, because now I’m thinking tax benefits. How about $500,000,000 a year, and I get to deduct chunks of it for the rest of my life… and since I’m not paying him all of it, it’s of no tax consequence to him. And for me… some fancy accounting showing the liability due, and then claiming the annual credit of $10,000,000 – wow, I’ll never pay taxes again!!
Welcome to the slippery slope of how tax avoidance (totally legal) slides into tax evasion (totally not).
Setting aside the cushy job she got in her daddy’s organization, Ivanka Trump was paid an extra $750,000 in consulting fees. Giving your kids money is no crime. Claiming it as a business expense, however, is quite a different story. What’s slowly coming to light is how many tens of millions of dollars Donald … [Continue Reading]
September 28, 2020
I’m not sure where our family tradition came from… the one where you break this fast, after 24 hours of no food or drink… with a shot of liquor. Single-malt scotch in my case. Let me tell you, that’s one way to shock the system.
Anyway, it’s been a day… did… I… miss… anything?
Exactly a month ago, my closing paragraph was this:
“The President of the United States may not be aware that there are two things in life that are a certainty… death and taxes. You can’t escape either….and history will not be kind in exposing his attempts to cheat on both.”
The gist of that article was more to do with the fake numbers he was now controlling, to direct the C19 narrative… things aren’t so bad, things are getting better, numbers are going down… and so on. Sure they are, Mr. President… they can say whatever you want, when you’re managing it.
I haven’t dug into it yet, but a superficial read on these recent stories implies one of two things: Donald Trump is either among the world’s worst businessmen… or, he ruthlessly cheats on his taxes. I suspect it’s a bit of both, but I’m curious which version his die-hard supporters would prefer? That they were sold a pack of lies? Like the ones who like saying, “Yeah, ok, he’s an abrasive asshole, but at least he knows business and deal-making and all that.”
Or… how about this: “Hey, hardworking American labourer who’s single and made $18,000 last year…you paid more in taxes than your “billionaire” president.
Pick your poison, Trumpers… what do you prefer? The (brutally) inept businessman? Or the ruthless, uncaring tax evader? Tough decision… but, if you have any sort of critical thinking ability left, what shouldn’t be a tough choice is the one you face on November 3rd.
View Original Post and All Comments on Facebook
September 27, 2020
Once a year, me and several million like-minded people fast – no food or water – for about 24 hours. For everyone, it’s a different experience… but one thing in common… for all, it’s a period of deep introspection.
If you don’t know what I’m talking about, feel free to Google Yom Kippur.
This Jewish Day of Atonement always comes exactly 10 days after the Jewish New Year (Happy 5781!). Since it’s based on the Hebrew calendar, which is made up exclusively of 28-day months (it always lines up with the moon), these holidays move around with respect to our conventional calendar. In fact, it’s especially nice to have a New Year’s a few months before the end of December… it gives you a second shot at those new year’s resolutions that maybe didn’t stick.
Next year, Yom Kippur will fall mid-September. The year after that, early October. You never know what day of the week you’re going to get. Like all Jewish holidays, it starts the evening before the actual day… which means tonight, in a couple of hours (sunset) – and lasts till tomorrow’s sunset. As I mentioned, for that period of time… it’s a complete fast, which includes switching off all non-critical electronics as well… in an effort to truly disconnect. Accordingly, tomorrow’s update with all the new numbers will have to wait till after sunset… which will be sometime after 7pm.
In the meantime, I’ll be lost in thought… and with no interruptions and with no food or water to balance out the brain chemistry, I’m looking forward to seeing what I come up with. You may be reading about it for weeks.
For all my peeps doing the same, Gmar Chatima Tovah – and may you have an easy fast. See you on the other side.
View Original Post and All Comments on Facebook
September 26, 2020
No numbers till Monday… though it’s worth sadly noting that by this time tomorrow, the world will have seen its one millionth C19 death. We have a long way to go with fixing things.
You know… “Fixing things” used to mean something positive… like, you have something, it broke, you fixed it… and now it’s good again.
The word’s more sinister implications… well, you have disgraced and disbarred former attorney Michael Cohen… Trump’s “fixer”… who fixed things like campaign finance violations, tax fraud and bank fraud. Evidently, like cheap scotch tape, his illegal fixes were temporary, and fell apart when put to the test.
I have a particularly fond memory playing poker. A friend went to the washroom, and in the 60 seconds he was gone, we “fixed” the deck. By the end of the hand, he’d put every penny he had into the pot, and lost it all on the last card. He couldn’t believe it, and we couldn’t stop laughing at the emotional rollercoaster we put him through. All in good fun; he was incredibly relieved to hear it was all a set-up, and he hadn’t actually lost his entire net worth. I suspect most fixed poker hands don’t end so well.
When it comes to elections, history has seen plenty of fixes… and some are so blatant, they’re ridiculous.
The Liberian general election of 1927 is a good example. There were 15,000 registered voters. One candidate received 9,000 votes – pretty reasonable. The other candidate received 243,000 (that’s not a typo).
It’s interesting to note that until relatively recently, like the mid-19th century, when you voted, you made your vote public. The British colony of Victoria, ie Australia, adopted a secret voting system in 1856… where a generic paper ballot was produced by an independent third party. Before that, each campaign would produce their own ballot, on a piece of paper with their own colour. To vote, you’d drop your selected coloured ballot… into a glass bowl. Surrounding those glass bowls would be party operatives or even the candidates themselves… persuading, bribing and even threatening the voters. It took guts to vote because, as you might expect, it was frequently a violent undertaking.
Fortunately, neither the American nor Canadian upcoming elections will be people publicly dropping red of blue pieces of paper into large … [Continue Reading]
September 25, 2020
There’s that old parable where, suddenly, people can’t bend their arms. There’s plenty of food to eat, but people are starving… because they can’t reach their mouths.
The parable goes on to explain how, actually, it’s only the self-serving narcissists that are starving. The good people have figured out that all they need to do is feed each other, and everyone will be ok.
To some extent, we’ve been told that masks are sort of like that; you wear one, more than anything, to help others; to avoid you infecting them with your sneezes and coughs… and, as long as everyone is doing that to help others, we all benefit.
For a lot of my life, I thought catching a cold or flu was like getting pregnant; you’re either pregnant or you’re not. Similarly, either you have a cold… or you don’t. Certainly, you can be 7 weeks pregnant vs. 7 months, and it’s a very different experience… just like you can have a mild cold or a really bad cold.
The subtle difference in my mind was this: Once you have a cold, how bad it is depends on that particular cold virus. Some hit you really hard, while some give you little sniffles. Some years it’s really bad, some years… not so much.
What I didn’t understand was the whole concept of viral load. It’s not necessarily the severity of the strain of the virus… it’s also how much of it you got. The actual level of dosage, the actual number of little virus balls you inhaled… like, how badly you were infected… has a huge influence on how it affects you.
This is becoming very evident with the analysis of C19 patients; those exposed with high viral loads have a much more difficult journey. In fact, viral load at the time of diagnosis seems to be, on its own, an independent predictor of mortality.
All of this goes back to masks, and a recent article that pointed out something that should be pretty obvious, but perhaps hasn’t been made abundantly clear: If you wear a mask, you’re not only protecting others, but you’re protecting yourself. Your chances of receiving a lethal infectious dose are dramatically reduced if you’re wearing a mask.
Further to that – a very promising conclusion that follows from that is that … [Continue Reading]