Travel Stories

Day 30 – April 15, 2020

The textbook definition of the word “optics” has to to do with light, and its interaction with the physical world. The most familiar adaptations we’re familiar with have to do with light interacting with our own eyes… optician, optometrist, ophthalmologist.

If you’re a professional photographer, this extends to different lenses and fields of vision and lighting and focal lengths and so on.

When it comes to business or politics, “the optics” refers to how it looks… to the general public. “What are the optics?” is the buzzword-question asked of advisors and consultants and marketers and branding experts and spokespeople and press secretaries — by the people behind the scenes who’ll care about the answer. How will the public take it?

Over this last long weekend, Prime Minister Justin Trudeau decided to join his family, who’ve been living in the Harrington Lake cottage for the last few weeks, for Easter. The cottage is in Gatineau Park, which is in Quebec.

That visit violated the social distancing orders that the federal government and every provincial government has imposed on its residents — the same ones Trudeau himself repeats every time he’s at the podium. That visit also violated the order with respect to crossing the provincial border which at the moment is supposed to be open only to essential travel.

And just to shove it a bit more in all of our collective faces — us, most of whom who stayed home all weekend, many of us who have cabins and cottages and places to where we’d love to have gone to get away from it all… and if not, especially in this beautiful weather, just pack up the SUV and go camping somewhere — he posted a selfie of himself and his family.

The picture shows a beautiful, smiling family of five, clear blue skies with a few light, scattered clouds in the background. Everyone dressed appropriately for the crisp, fresh air. A few wispy trees. The lake itself in the distant background. From a photographical optics point-of-view, excellent. From a political optics point-of-view, awful. Just awful.

Forced to explain himself, the PM gave a somewhat meandering and deflective comment. Within his statement was the sentence, “We continue to follow all the instructions of the authorities.” You’re supposed to be the top of that authority, Mr. PM.

Meanwhile, on the other side of the country, not to be outdone, Conservative leader Andrew Scheer stepped onto a government jet in Regina with his entire family, completely destroying any semblance of social distancing a 9-seater plane may have been able to offer its present two occupants. Why would his family, who one would think should be isolating at home in Regina, need to be heading to Ottawa. In a normal world, that last sentence would have a question mark after it, but these rhetorical questions don’t need them because the answers are self-evident.

We seem to have been dealt a fortunate hand here in B.C. — our provincial leaders convey a calm, consistent message with logic and transparency. They walk the walk, not just talk it. The plan is collective; you hear the word “we” a lot, and that “we” includes them. One wonders what that might look like at a national level. Like, how would it look if there were an entire country being guided by the calm, clear plan and intelligent reassurance we hear almost daily from Dr. Henry? What would it look like if B.C. were its own country and had control of its borders and could independently navigate this entire ordeal?

That particular rhetorical question actually has an answer: New Zealand… which coincidentally has a very similar population of around 5 million people. But the similarities don’t end there.

Their Prime Minister, Jacinda Ardern, has a lot in common with our own Dr. Henry. She stands up in front of her people, she speaks calmly and intelligently and pulls no punches when expressing the seriousness of the situation… but at the same time, is reassuring and inclusive and transparent. She is very much one of them, and she knows how to talk to them, and they listen.

On March 14th, when there were only 8 confirmed cases in the entire country of New Zealand (B.C. was at 73, Canada at 252), PM Ardern clamped down hard and implemented all sorts of measures that have now become familiar to all of us; 14-day isolation upon returning from out of the country, canceling cruise ships, cancelling big events and festivals. She went on TV and said a lot of things, many of which will sound familiar… “We will get through this together”. “Be strong”. “Be kind”.

Eight cases might sound early, but the results have been better than anywhere else on the planet. She saw what was happening around the world, she realized that time was of the essence and that even the slightest variation of the initial conditions (see yesterday’s post) can make a big difference. If she erred, it was to the side of caution, which these days might be the only right way to be wrong.

One of the sound bites of that TV address was her plea: “We must go hard and we must go early”. It has been said that this is the same sort of rallying cry that the coach of the New Zealand All Blacks might give his players before a game. My personal experience playing a rugby team from NZ would agree. They proceeded to go hard and go early and destroy us. Great bunch — this was in high school, so there were no after-match drinks, just handshakes, but I would’ve enjoyed a pint with those guys. Their game was disciplined, cohesive and well-executed. It was all business, from start to finish.… much like New Zealand’s response has been so far. And that’s why they’re winning; they can all relate, and there is tremendous trust in their leadership and the plan. It looks and sounds good, and it’s working. Good Optics.

Justin… Andrew… come on guys, you can do better, and the country deserves better. We need better. You’re both “one of us” too. Lead by example. Don’t just tell us what to do; do it yourself as well. Lead by example, because mixed signals and a “the rules don’t apply to us” attitude — Bad Optics.

View Original Post and All Comments on Facebook

Day 29 – April 14, 2020

In simple terms, there are three initial conditions to consider if you’re going to fire a cannon: the weight of the cannonball, how much gunpowder you load into the cannon, and the angle of the cannon when you fire it.

If you’re trying to figure out what effect changing those variables can have, the right way to do it is to fix two of them and then see what happens as you vary the third.

For example, set the cannon at a 30-degree angle, and use the same weight of cannonball for 5 shots. Pack each of those 5 shots with increasing amounts of gunpowder… like 10, 20, 30 pounds and so on.

After you’ve fired those five cannonballs, measure the different distances and graph them. And draw a line through those 5 points… and extend it, beyond the last one, following the shape of that line. It might be perfectly straight. It might curve a bit. This is called extrapolation, and lets you make a pretty good guess as to what would happen if you had kept adding more gunpowder.

Now, do the same… this time, use the same amount of gunpowder, but use different weights of cannonballs. Graph and extrapolate that too.

Finally, pick one of those cannonball weights and a fixed amount of gunpowder, and fire them all, changing the cannon’s angle by 5 degrees each time. Graph and extrapolate.

Given those three graphs and their extrapolated lines, you now have a pretty good idea of how to fire this cannon, depending on what you desire. There may be many ways of hitting a target 500 yards away, but one uses more gunpowder. Or maybe you want to hit it with a bigger cannonball. Maybe there are trees in the way, so you’ll need a steeper angle.

One thing that’s certain; the only control you have with this cannonball is what you set with these initial conditions. Once you light that fuse and the cannoball blasts its way out of there, there is nothing you can do about its trajectory. Hopefully you got it right.

It occurs to me that a more modern and relevant example would be golf. When you’re trying to hit a golfball into a hole 150 yards away, there are many variables to consider, and usually, too many for most people, all at once. Pick the right club, but after that… the wind, your tight grip (but not too tight), feet shoulder-width apart, bend your knees, lean forward, keep your waist straight, look at the ball… etc etc. There are many more, and very few people are able to maintain all of those, all at once. And one initial condition out of place affects the whole thing. And again, like the cannonball, once you hit the ball, all you can do is watch.

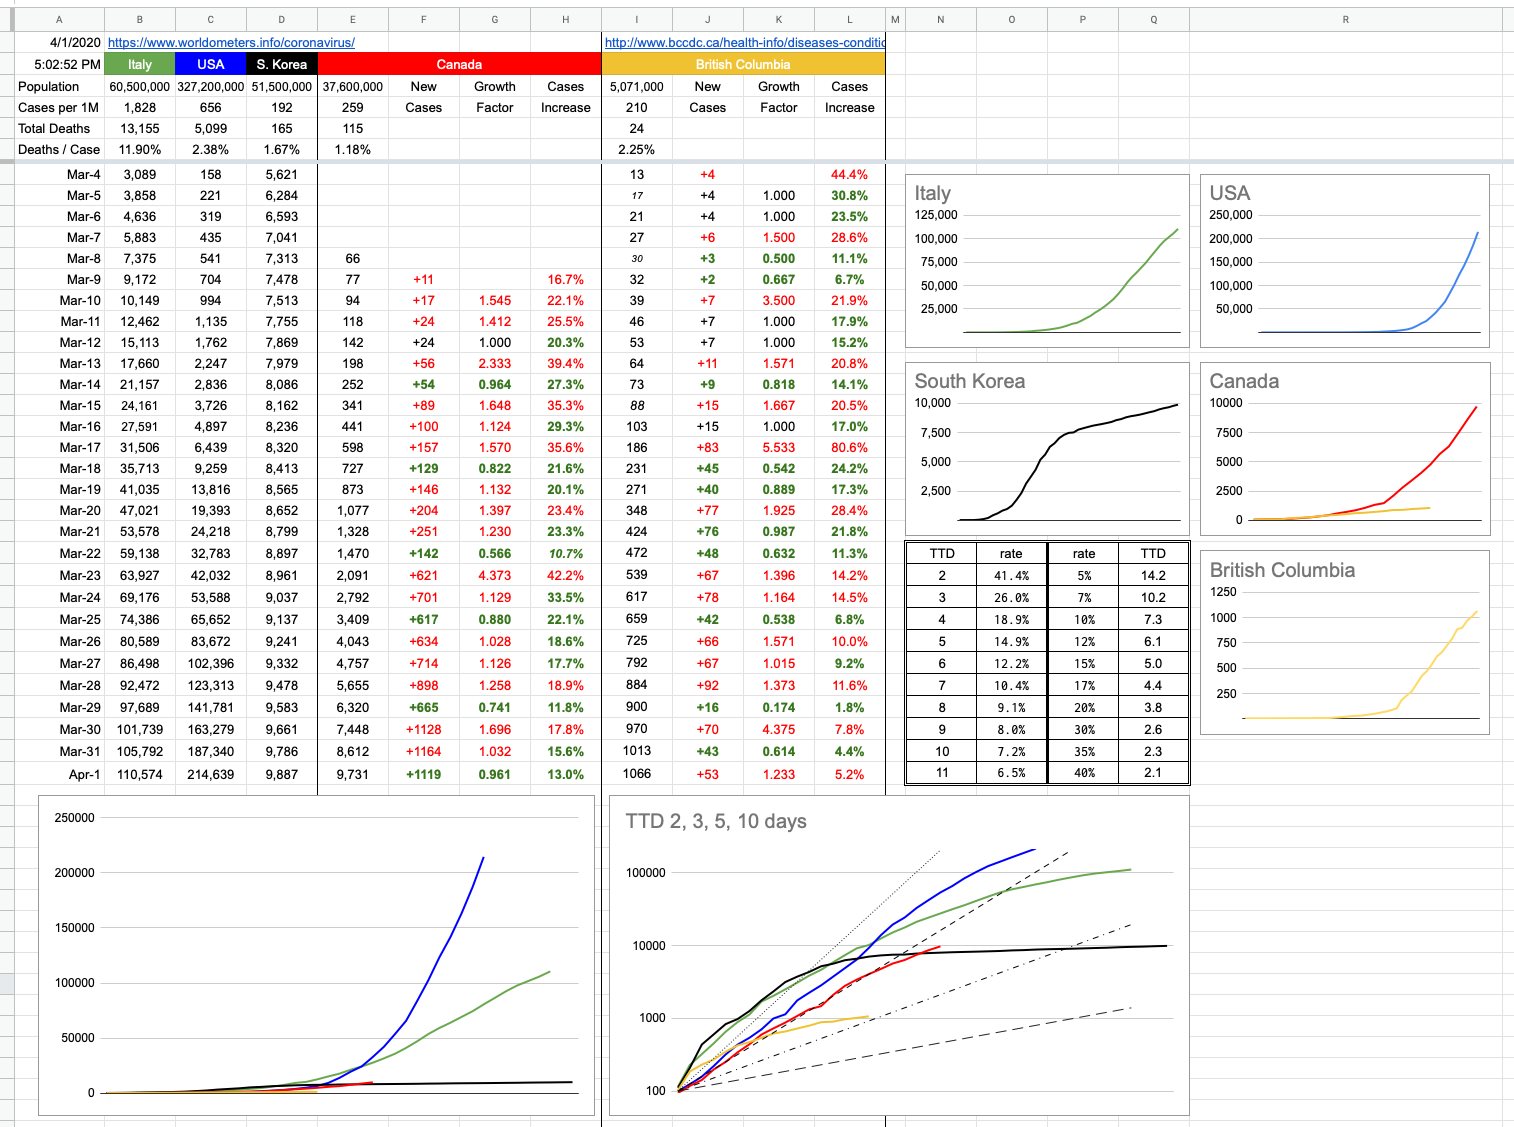
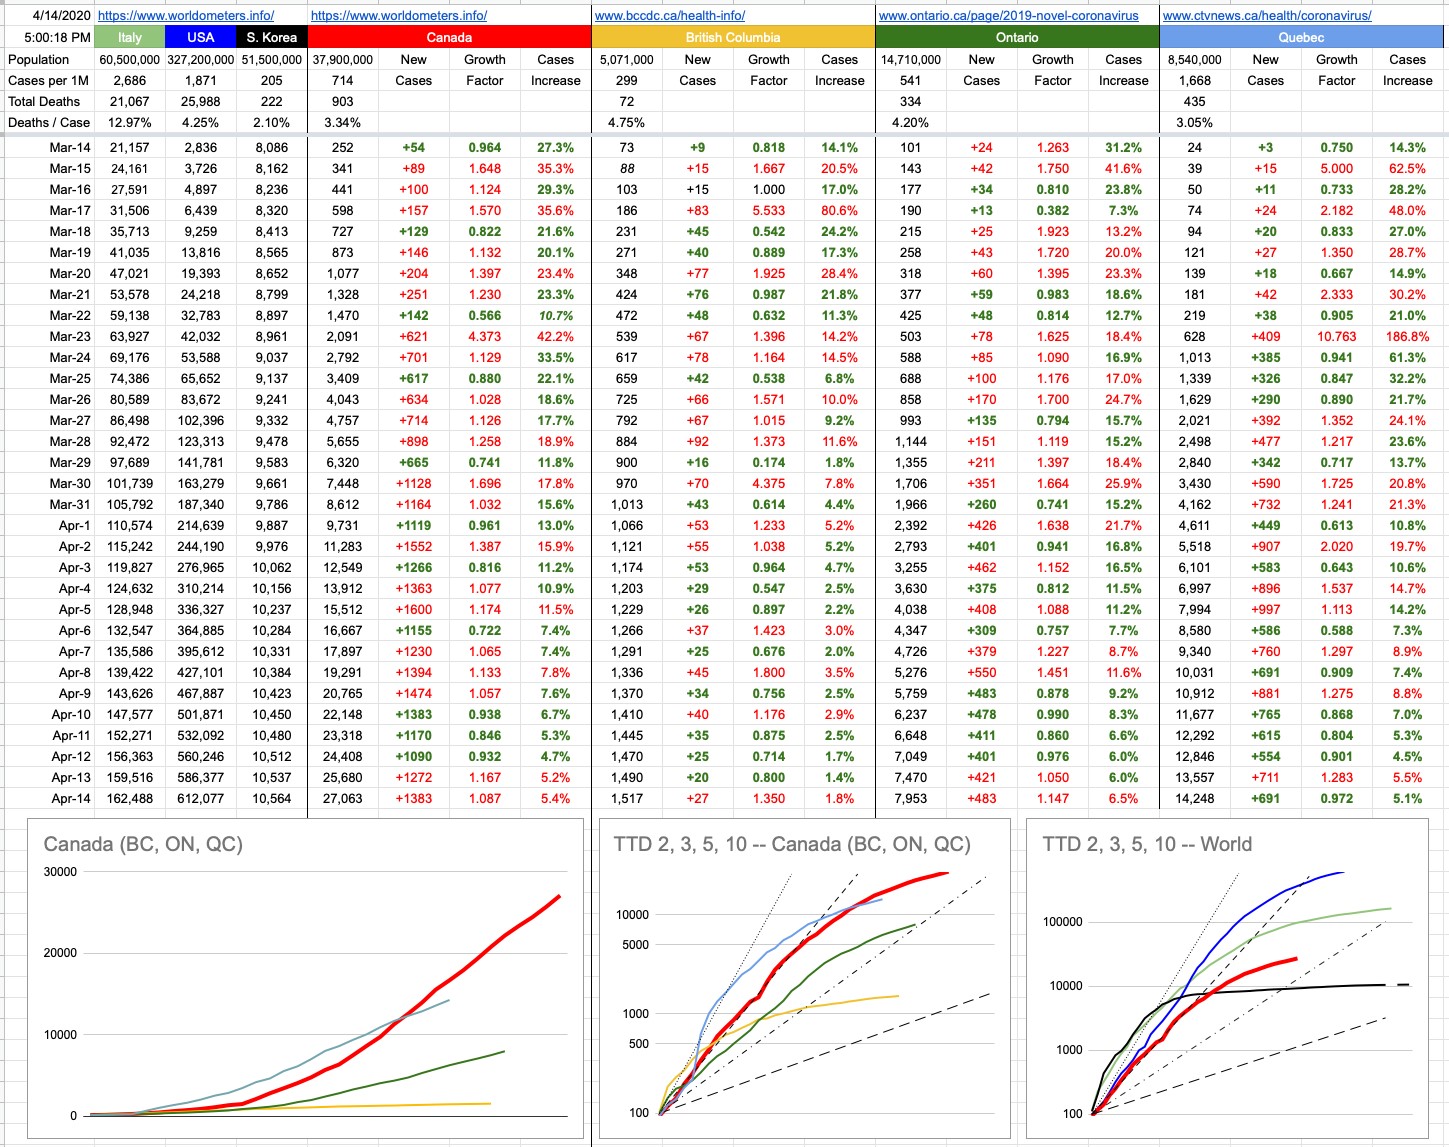
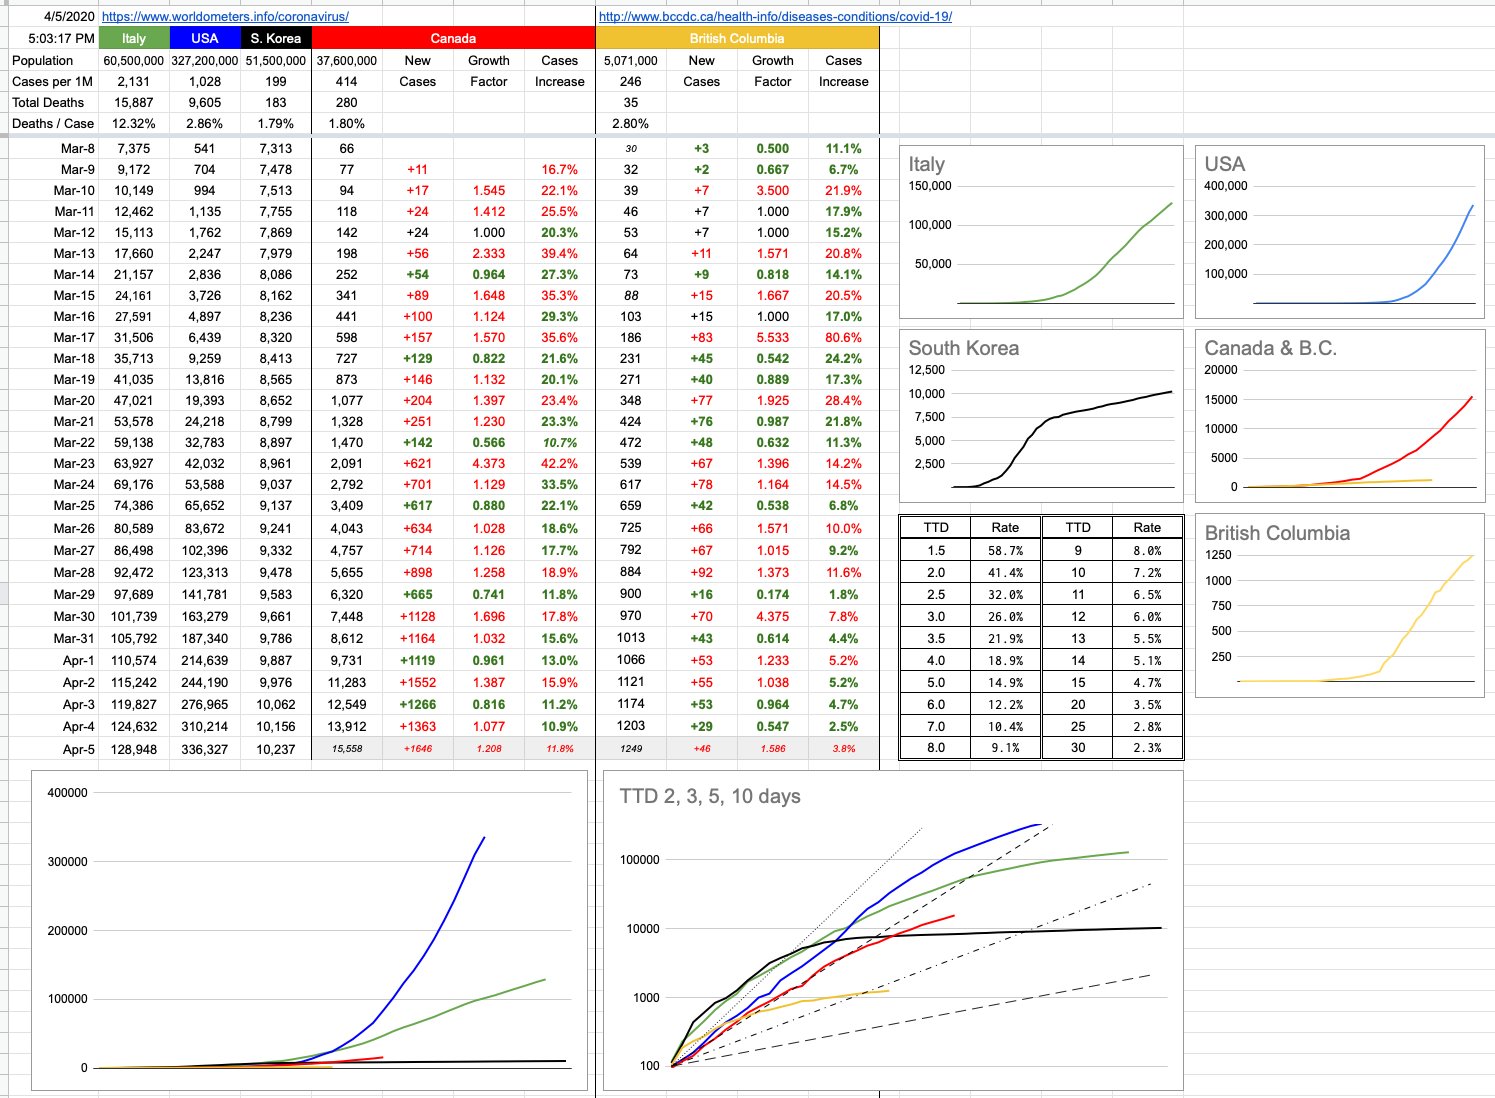
When you look at the graphs in this picture, it’s not hard to visualize where these lines might be going, given the trajectories shown. If you look at the TTD chart for the world, the one on the far right, you can see the red Canada line in between the black South Korea line and the green Italy line. For a long time, we were hearing thing about which trajectory Canada might be following, using those two countries as examples… ideally, South Korea… but, worryingly, looking like Italy.

Ideally, our red line would’ve bent harder and right, sooner. It didn’t, but it also didn’t follow Italy, though the shape is the same, and using extrapolation, all things being equal, we can tell where we might wind up with respect to cases, if nothing changes.

Except all things are not equal. Unlike cannonballs and golfballs, the big difference here is that we can course-correct, and we have. Our red line and the American blue line were on top of each other for a while… until around March 26th, where things diverged rapidly. Implementing changes makes a difference, and the timing of it is key. A few days sooner or later makes a big difference.

It’s important to note that there were many initial conditions, both here and around the world, that affected things greatly. A big crowd at a soccer game. A large church gathering. Staggered Spring Break dates. The Canucks were away for almost two weeks after Feb 22nd. An endless list of endless jurisdictions where at the right place/right time, some situation that may have brought together a lot of people from lots of different places — did or didn’t happen, for whatever reason.

We will be shown some modelling later this week, and some “what if” scenarios. The biggest “what if” around has to do with properly implementing the measures that have been imposed in many places (including here), and the effects they’ve had. There is some guesswork and some assumptions, but they’re intelligent guesses based on what’s been experienced elsewhere. Extrapolated graphs are part of it. And every indication is that what we’re doing has made — and continues to make — a big difference.

View Original Post and All Comments on Facebook

Day 28 – April 13, 2020

Once in a while, we have a movie night here at home…. who are we kidding, every night is movie night these days… and recently (well, before Tiger King), we saw a movie that could best be described as a combination of Groundhog Day and… Alien? Predator? War of the Worlds? If you’re not familiar with Groundhog Day — you should see it. To some extent, it feels like we’re living it these days… but to summarize (spoiler alert), in the movie, a normal guy (well, Bill Murray) is caught in a time loop where he lives the same day over and over until he’s finally lived it perfectly and then his life can go on.

Those SciFi movies I listed all have in common the good-guy-humans vs. the bad-guy-aliens. In all cases, the good-guy humans prevail, with varying degrees of importance… saving themselves, saving the world, saving the universe.

Mix the two together, and what you get is humans vs. aliens, but with an interesting twist. Typically, our hero goes from battle to battle, close call to close call… until finally, he prevails. But in this movie, our hero keeps dying… because these aliens are seriously powerful. He doesn’t last more than a few minutes the first time. But as time goes on, he gets a little further along in his quest to kill the aliens — before he’s killed, and then wakes up the next day, and starts all over again. It’s a Hollywood movie (Edge of Tomorrow) with a Hollywood A-lister (Tom Cruise), so (spoiler alert) you can guess the ending… but here’s the takeaway of the whole thing… when he finally gets it right, when he finally — after brutally and painfully dying hundreds of times — is able to extinguish the aliens and life can go on and humanity is saved… nobody knows. It’s like nothing ever happened. It’s like the aliens never even showed up. All of humanity benefitted from the suffering this guy endured, but no one will ever know.

As we starting emerging from lockdown and navigate the complicated plan of getting back to normal, more and more of the crazies will emerge. There was a protest over the weekend where some people with “Fake News” and “CON-VID-19” signs showed up. Apparently, this is all a big conspiracy to… to… well, to what? These guys typically bundle-up all of the current conspiracies, so it’s difficult to unravel a logical narrative that might even make sense. The Chinese created it and activate it with 5G and have the vaccine but won’t give it to us but killed thousands of their own people to show it’s real but Deep State and Illuminati and government power-grab and… and… well, even if that mess of insanity were true, how exactly does Canada figure into it?

Locally, Kennedy Stewart, mayor of Vancouver, is getting increasingly worried that this city is reaching insolvency… and it’s a serious concern. As this goes on, fewer and fewer people will easily be able to pay the their mortgages or rents; where and when they can, they will. That’s the priority. Property taxes, which greatly fund this city, are lower on the list, and the many people who will throw their hands in the air and say, “What exactly do you want me to do? You know I haven’t worked in 3 months” have a good point. These taxes may be deferred and eventually will probably get paid (“deferred” is very different than “forgiven”) but the city needs money now. So they asked the provincial government for $200 million. And Victoria isn’t themselves rolling in cash these days either, so they will have to ring up Ottawa with a similar request. This then gets into a more complicated discussion at the federal level regarding literally printing money vs. inflation vs. stimulus vs. many other things, none of which are great for this country in the long run… which begs the question — to what end? To what end might the Canadian (or provincial or municipal) government be involved in some giant conspiracy? Not that you can ever intelligently argue with these people, but I’d love to hear that particular answer. We have created a big massive hoax which hurts everyone… across the board, everyone is suffering, including every single one of those government workers and officials… it will take years for us all to recover… because WHY?

I’ve made the mistake of answering a few of those sorts of messages privately, and my well-reasoned arguments are simply answered with “You just don’t get it.” On that, we can certainly agree. No, I don’t get it and I never will… but what I will point out is that all of those idiots will end up benefiting from the sacrifices we’ve all made, and it sounds like they won’t even be able to recognize it. We are all Tom Cruise.

And when the pandemic doesn’t get out of hand here, because of all of the intelligent and necessary measures that were put in place and that were followed by most of us, these are the idiots that will proudly be announcing to everyone, “See? There was nothing to worry about. This was never a concern, never a problem, and all of you bought into it. Sheeple!!”

That’s ok. You, like Tom Cruise at the end of that movie, can just sort of chuckle to yourself. You, me, we all took the hit for the greater good, and it was an expensive one… but we will recover.

And when and how exactly do we start that recovery? I’ll be happy to offer my completely-non-expert opinion in the coming days, and there are some encouraging signs to guide that. One is that the numbers really do look good. If you scan down the columns labelled “Cases Increase”, they tell an optimistic story, and not just in B.C.

Also… here in B.C., serological antibody tests are just around the corner… within the next couple weeks. This is the test that can tell you whether you’ve ever had the virus, symptoms or not. I don’t know what the rollout looks like… in a perfect world, we’d all get one instantly and we’d know our own status and that would obviously guide a lot. That’s not how the world works, but whatever way gathers the most information quickly and efficiently — that’s what we’ll see.

Until then… it’s working. Keep doing it. That light at the end of the tunnel is not a train screaming towards us.

View Original Post and All Comments on Facebook
Day 26 – April 11, 2020

For the sake this example, I’m about to virtually kill a lot of people. Please don’t feel bad — they never existed.

Let’s imagine you want to drive from Vancouver to Seattle… and let’s further imagine that there’s a winding road that follows the coastline all the way down. Sidenote — for part of it, there is… there’s a 20-mile winding road from Bellingham to Burlington called Chuckanut Drive that’s well-worth the detour. Spectacular views and much more.

So… there’s the imaginary coastline road, and there’s Highway 99/I-5 which actually exists.

And you’re a new driver, kind of nervous… the thought of the fast-moving traffic on the highway scares you a bit. But you also know the coastline road is very winding, and you’ve heard of cars losing control and going over the cliff. You do your research and quickly find a report that tells you that over the last two years, accidents killed 45 people on the highway and 24 on the coastline road. Again, I’m making this all up. Nobody was hurt in the creation of this posting.

No brainer, you think, the coastline road is twice as safe as the highway… because that’s the ultimate measure of safety, and there can’t be too much more to it…

Well, there can be… and if you keep reading down my imaginary report, you’ll find that the coastline road seems to have about one accident a month. Like clockwork, once a month, a single-occupant vehicle loses control, rolls down the 100-foot cliff and kills the driver. That accounts for the 24 deaths.

On the highway, as it turns out, some idiot last year was celebrating something… and rented out one of those monstrosity stretch Hummer limos, filled it with 43 of his closest buddies… and apparently everybody, including the driver, got drunk… and the limo, with its full tank of gas, crashed into a telephone pole, exploded into flames and killed all 45 occupants.

That changes things a bit, doesn’t it…

Those 24 single-car accidents each have a little circle around them. The HummerLimo has a single, big circle around it. Around here, the Lynn Valley Care Centre has a big circle around it too, as does the administration office of Lions Gate Hospital. The Mission Institution. The Okanagan Correctional Centre in Oliver. The Blueberry River First Nations community near Fort St. John. All of them have their own little circles.

So… let’s talk about clusters.

From an epidemiological point of view, a cluster is defined by infections that are grouped by where and when they happened. If those two things are close to each other, they’re part of the same cluster. Infections can be clustered, deaths can be clustered. Really, any statistic can (and usually should) be associated where it’s relevant.

In B.C., the Lynn Valley Care Center (where the average age of residents is 87) recorded Canada’s first COVID-19 death on March 8th. Since then, it’s accounted for an additional 17. Here in B.C., our mortality rate per resolved case is 6.0% when you count Lynn Valley, and 4.3% when you don’t. This is in no way minimizing the importance of each and every one of those people; rather, it’s just to point out where they should fit in statistically.

Treating those unfortunate 18 deaths the same as any random 18 in the city would skew things significantly; there’s clearly a lot more to learn about those 24 individuals that drove off the cliff than by analyzing the demographics of the 45 people in the limo.

This is all something to keep in mind when reading reports that tend to favour skewing data towards their intended conclusion… something I’m saying for my own benefit as much as yours, because these days I’m being bombarded with articles and reports and opinions, many of which are diametrically opposed to each other. All of them claim credible evidence. I’m trying to keep a level head, and you should too.

As for today’s numbers… well, it’s green all the way across the bottom. From a purely aesthetic point of view, that’s as good as it’ll ever get… and it’s what I consider great evidence that what we’re doing is working. Let’s keep at it, and let’s hope those people that aren’t such good listeners don’t become clusters of their own once this long-weekend is over.

View Original Post and All Comments on Facebook
Day 25 – April 10, 2020

There’s an interesting experiment going on, on the other side of the planet. Our furniture-making, meatball-eating, hockey-dazzling friends in Sweden’s approach to managing this crisis is a lot different than what’s going on around here. We’ve seen a few examples around the world how not to do things. How a few days here and there can have a drastic effect. How not taking it seriously can have big implications. The Globe & Mail wrote about Sweden last week. CNN picked up on it yesterday. Sweden, not a culture that I would associate with recklessness, is taking a huge gamble. If I were a betting man (and I assure you, by any definition of that expression, I am), even I wouldn’t rolling the dice the way they’re doing it.

I will summarize the articles, add a few comments… and something they left out.

To summarize, their schools are open, their pubs are open and there’s no lockdown. Gatherings of more than 50 people are banned, but everything else is left up to the honour system. Trust that others will do the right thing. Recommendations, not orders. Their PM calls it a “common sense” approach. Their chief epidemiologist is saying that it’s working “reasonably well” so far, and that they’ve had “not very much” spread into elderly homes and “almost no” spread into hospitals. In other words, it is, at best, working ok, but it’s in the elderly homes and it’s in hospitals. So basically, it’s everywhere.

Not everyone has bought into the plan… a letter from 2,000 doctors and public-health experts went out, urging the government to get a reality check. But for now… many Swedes get it, and are isolating and maintaining social/physical distancing. But also, many are hosting big family Easter celebrations this weekend. How will it all play out? The articles suggest we’ll know “next month”. I think we’ll know a lot sooner.

A quick look at numbers shows a sharp increase yesterday… like, double the number of new cases from the previous day… a 12% increase, implying a TTD of 6 days… so if that rate remains constant, their 9,000 cases will be 18,000 next week and 36,000 the following week. I will say that the growth rates before that were lower, and as I said yesterday, one day doesn’t make a trend. But the whole thing makes me very uneasy.

Some other numbers that are troubling and not mentioned… once you become infected and are verified by a test, you become a statistic. Your statistic will get modified as time goes on… symptoms or no symptoms, hospitalization or not, ICU or not and so on. The final statistic you will have attached to you is in the “Resolved” category, and it can go one of two ways: Recovered or Deceased. To be clear, this doesn’t include anyone who may presently have it, symptoms or no symptoms… this is exclusively those who definitely had it, and now definitely don’t. At last tally, Sweden had 1,251 resolved cases.

Here are the numbers, for comparison… for all known resolved cases, these are the percentages of those who fully recovered:

South Korea: 97.2%
Canada: 91.3%
Italy: 61.8%
USA: 59.5%

And while we’re here… BC: 94.1% — and that number would be higher were it not for the type of clusters (like long-term care homes) that we’ve experienced here.

And Sweden…? 30.5%.

Out of 10 people in Sweden who’ve had this thing and it’s run it course, 7 have died. Which seriously brings to question how deeply they have their heads buried in the sand. That is a staggering number for a first-world country that claims to have things under control. I hope they come to their senses soon.

Closer to home…

There seems to be some confusion when it comes to physical distancing. Stay home or go out in the sun but don’t get together with others and jog, but away from other people and bike, but not where others do, so bike lanes are sort of not ok, so what’s the deal…

Here’s the deal. You can go out if you pretend the following… pretend that you’re carrying this virus… you’re very fortunate that you have no symptoms, but you’re very infectious… and, if you give this to someone else, the moment you do, a lightning bolt will shoot out of the sky and strike you dead, instantly. Just like that.

So… what do you need do to avoid that? A mask or mouth covering helps… a lot. It doesn’t help you as much as it helps others, but like that parable where everyone’s arms are frozen straight out and everyone fears they’ll starve to death because they can’t feed themselves… well, duh, just feed each other. Everyone wins when you do your part.

When you cough or sneeze, you eject particles into the air…. little droplets within which the virus is carried… and those droplets can hang around, suspended in the air. Not for hours, but for several seconds. While the virus itself is small enough to penetrate most fabrics, water droplets are comparatively much bigger… so wearing a mask is like coughing or sneezing into your elbow or a handkerchief.

Assuming no masks, if you’re walking single file outside with other people (Arbutus corridor, seawall, sidewalks…), maintain a distance of 4 to 5 meters. If the guy in front of you coughs or sneezes, it’s unlikely to reach you. If you’re jogging or slow biking, 10 meters. And normal biking, 20 meters. And if you’re heading towards each other — well, you’re in the wrong place. As much as I enjoy cycling, not there, not now. Someone else just breathing hard, let alone coughing/sneezing — within 20 meters of us approaching each other — I would be breathing his exhaust. I don’t want to do that.

The numbers across the country look good. Flat, or lower… let’s keep at it… and hope that the people who decided to ignore what Dr. Henry and Mr. Dix said about 100 times this week…. “This is not the time to…”, and jammed up the ferry line-ups this morning, and swarmed Victoria and the Gulf Islands — don’t wreck things for all of us.


View Original Post and All Comments on Facebook
Day 24 – April 9, 2020

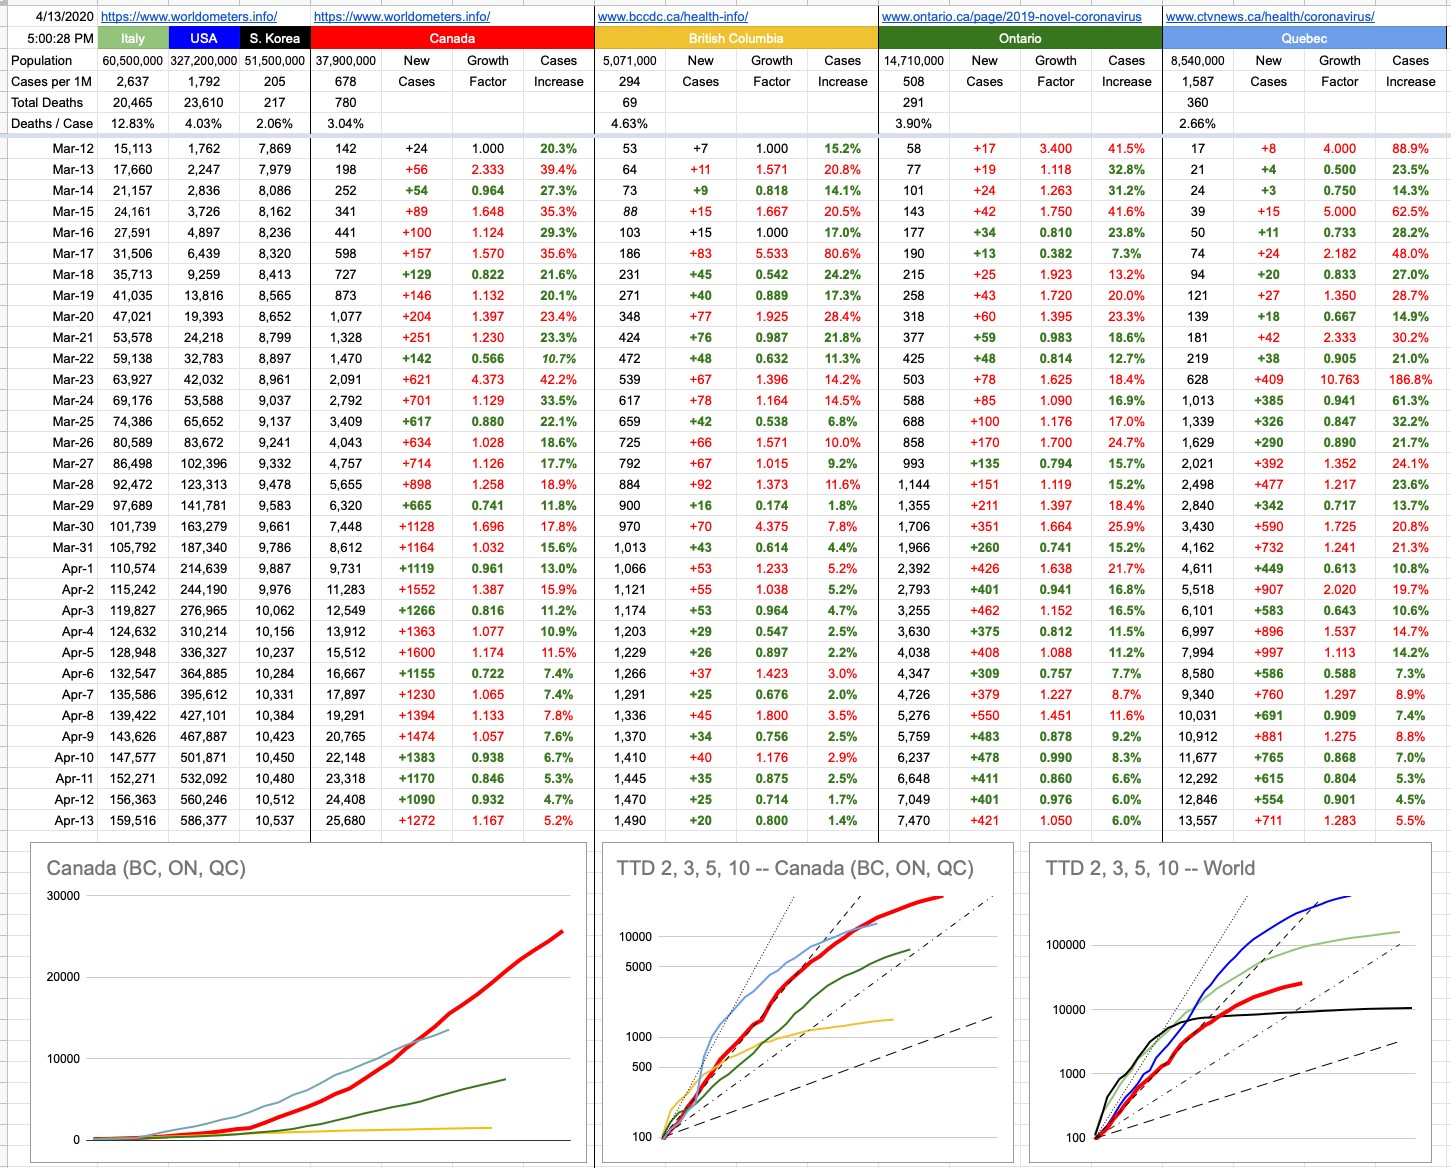
Oh, Canada… our home and native land is a lot more relevant to the majority of people reading this, so I’ve made some changes. You will notice that the original graph that started this little daily update is gone. It’s served its purpose, which originally was to map an apples-to-apples comparison of Italy, the U.S. and Canada — with South Korea thrown in for reference — if you were to superimpose their trajectories from a comparable starting point. When that started, Italy was 10 days ahead of the U.S. and the U.S. was 10 days ahead of Canada. On the graph, all of those lines were on top of each other, and it was going to be interesting to watch what happens as time goes on.

To summarize what has happened since… and you can look at yesterday’s final version of that graph to see what I mean (or go back even further and see when things really started to diverge)… The U.S. was actually doing better than Italy for a while, until all hell broke loose… then they burst through that green line and have never looked back. Italy, while still in the midst of their crisis, has definitely seen its curve flattening. Canada, for a while worryingly tracking the U.S., “fell off the bottom” of that blue curve and has comparatively been doing a lot better. The B.C. line, on this scale, is indistinguishable from the X-axis. Indeed, it’s the scale of this graph (linear Y-axis) that has rendered it useless. The unfortunate blue-line numbers will just keep squashing the other lines down, so we retire this graph with full honours, though I will still track the data and update the TTD logarithmic graph of Canada vs. The World.

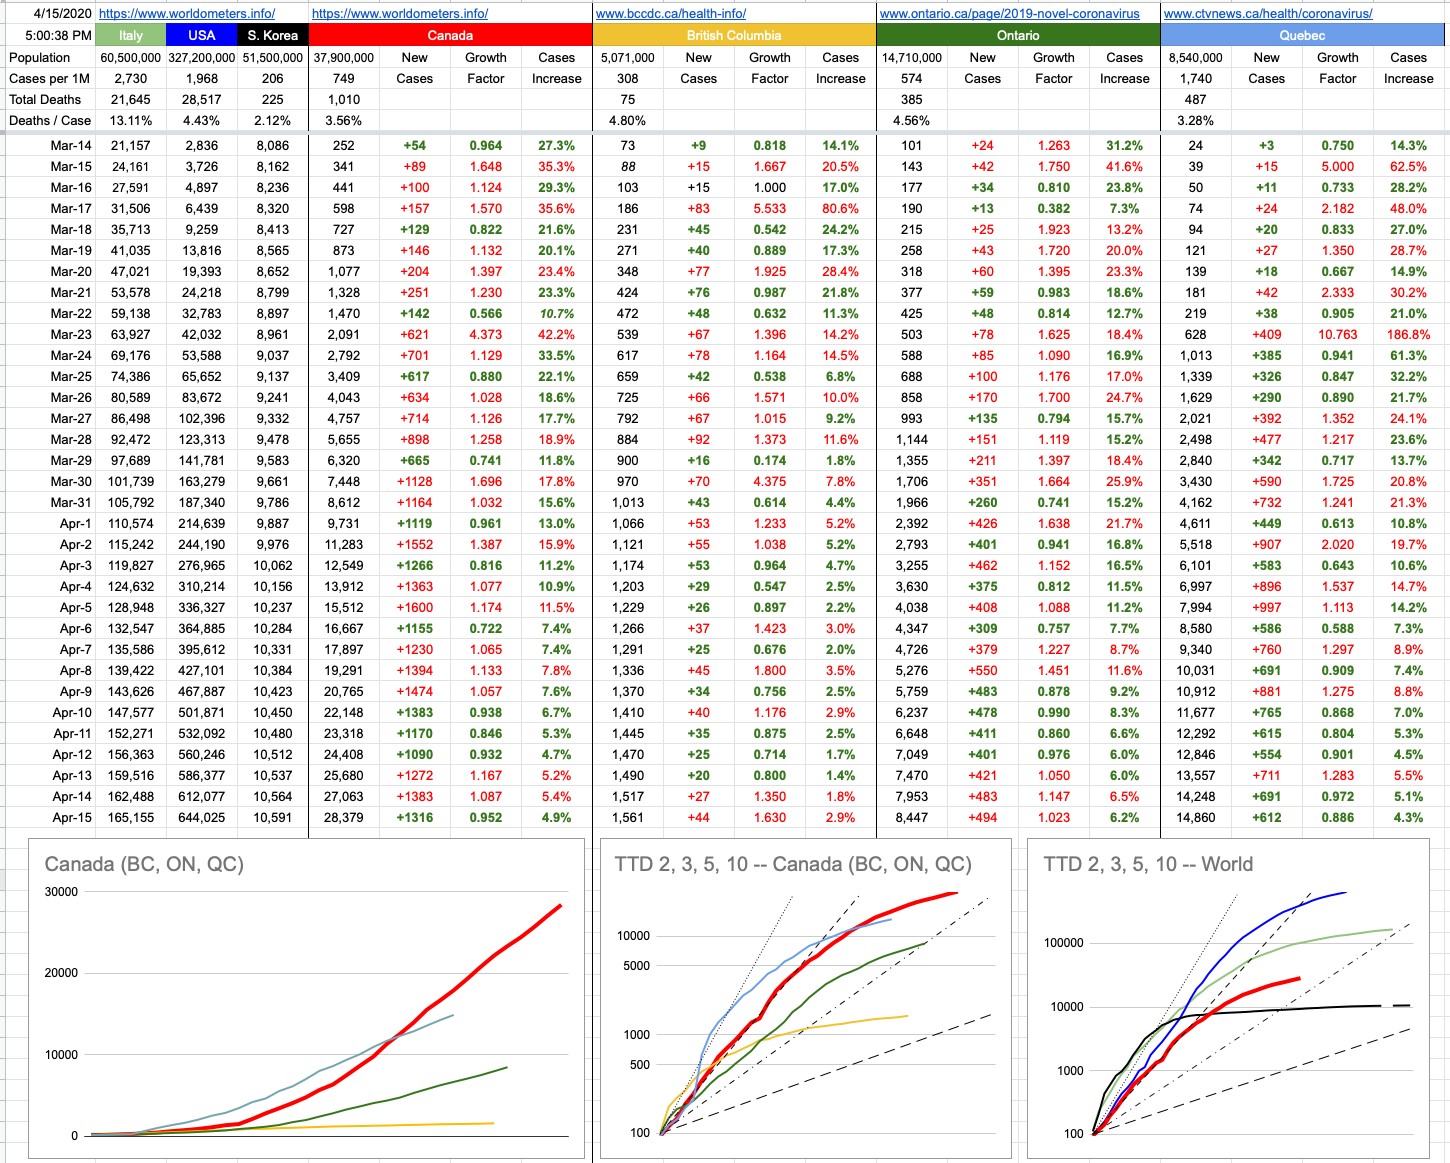
But there are two new graphs… one, on the bottom left, is exactly what I described above, but just for Canada… with B.C., Ontario and Quebec. You will notice with some degree of curiosity that the Quebec line is above the Canada line… how can that be? Isn’t Quebec still part of Canada? Let’s not have that particular discussion, right here, right now. Yes, of course they are, so what’s the deal?

Nos amis from la belle province, with their usual panache, were simply late to the party. Given that this graph aims to compare apples to apples, its starting point is the same for everyone. Quebec recorded its 100th case March 18th or 19th. On that day, both B.C.and Ontario were around 250 each. Canada’s total was around 800.

Forgetting when it happened, but rather how it happened, Quebec’s numbers were not great for a while; they quickly accelerated at a frightening rate. They went from 100 to 1,000 cases in 5 days… a pace that exceeds Canada’s overall trajectory. The good news for our frères and sœurs is that things have recently looked a lot better. In fact, while numbers keep growing, they are growing more slowly. The “Cases Increase” percentage columns all tell that same story. Social/physical distancing… you know.

Where are the Prairies, the Maritimes, the Territories in all of this…? Listen, you don’t want to be on my charts… I aim to chart the big, significant numbers. Hope you never get so relevant that you need your own data column and squiggly line… anyway, there are only so many colours.

Special shoutout to Nunavut… with respect to this pandemic, they are having none of it. Ha Ha!! (Sorry). But indeed, they’re the only province or territory with zero cases. How it that possible? It’s very simple… the population density of our northern compatriots is 0.02 people per square km. In other words, everyone up there gets their own 50 sq. kms. In other words, go up there and draw a square that’s 7km per side. It’s all yours. It’s also really cold. All of that combined equals automatically-imposed social/physical distancing. And check it out… zero infections. Case closed.

View Original Post and All Comments on Facebook
Day 21 – April 6, 2020

When you’re on a plane, approaching the end of a long flight… if you happen to be paying attention at about 30 minutes before landing, you may notice the hum of the engines drop a semi-tone or two. And you will feel the nose of the plane pitch forward slightly. This is the result of the pilots reducing power to the engines, which is the first step of many needed to land the plane safely. It takes about 30 minutes to bring an airliner flying at 35,000 feet and 500 knots down to 0 feet and 0 knots. Indeed, there are ways of doing it much faster than that, and they’re highly not recommended. If you want to get the plane and all its occupants down safely, it’s a process, and that’s how long it takes. But what if we just “dive steeper”? Or just crank the engines and point it down and “go down faster”?

Anyone who’s ever pitched a proposal can tell you what two questions need answering first: how much will it cost and how long will it take. The cost is often negotiable. The “how long” often is not. Some processes can’t be altered nor compromised nor made better nor anything. You want a baby? You need a man and a woman and 9 months. Well, jeez… I’m in a hurry… what if we put 9 men on the job… can we have that baby in a month? Uhhh…. no.

That plane is in the hands of two people who know what they’re doing, and we put our trust in them, and they always seem to deliver. But if you happen to be sitting back in 29B, sitting next to “an expert” who’s explaining to you everything the pilots are doing wrong (“Hey see how that flap extended, man that’s gonna slow us down and burn more fuel, that’s no good, why’d he do that”), then you might understand how I’m feeling today after posting something yesterday that an awful-lot more people than usual read.

I like my plane metaphor, because it’s useful in two directions.

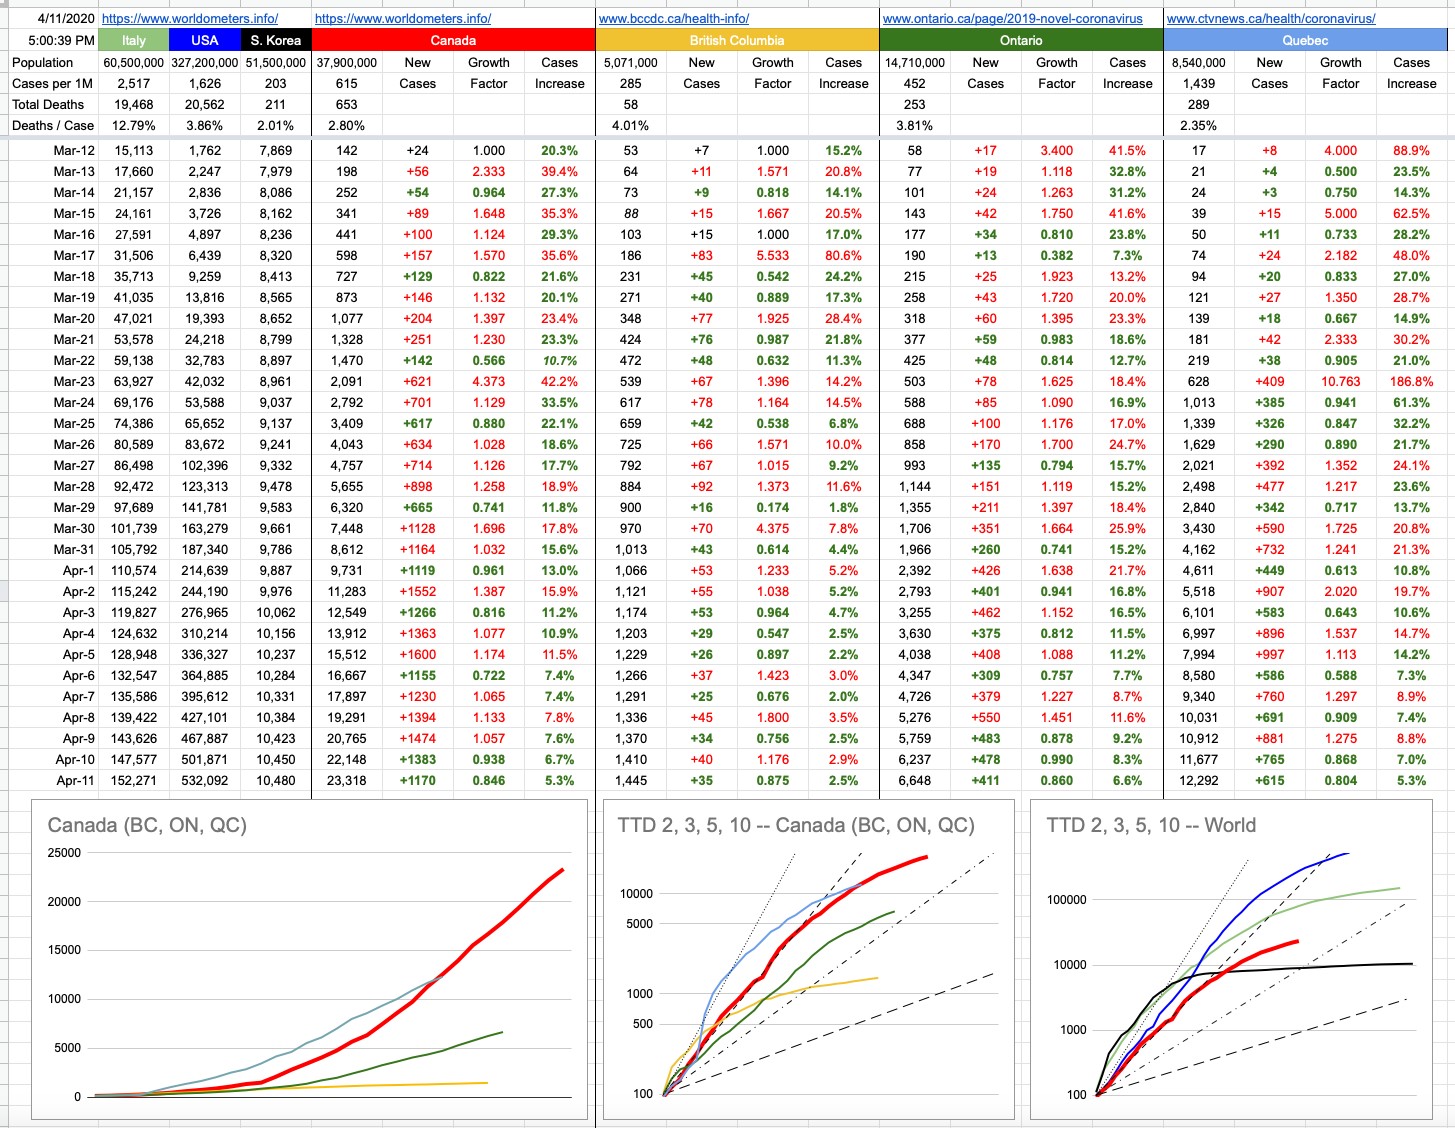
Number one, and more important… today is “double-header” day here in B.C. — we get both yesterday and today’s numbers of new cases, and that can go one of three ways… two wins… or two losses… or a tie. A quick eyeballing of the days leading up to today would imply that anything below a 5% case increase would be a win for either day. Less than 4% on both or either would be great.
The numbers were 2.2% and 3.0%, which are both really excellent. But as our resident captain and co-pilot keep telling us, we haven’t landed yet. Stay in your seat and keep your seatbelt fastened. We’re not there yet. And if you stand up now, we might hit some turbulence and you could get really hurt, or hurt someone else. See? Good metaphor.

Number two, I find it fascinating that everyone who 6 months ago was an expert on impeachment hearings and the way the senate works and immigration and indigenous rights… is today an expert epidemiologist.

The best evidence I have that I’m no expert is that it just took me quite an effort to spell that word correctly. And I don’t claim to be. I am an expert with computers, and I’m pretty good with numbers and I suppose I have a way with words… which leads to this possibly entertaining and hopefully informative but in no way expert opinion of what’s going on around us. Give me some numbers, and I can make some pretty graphs with pretty colours. I can map some tables with pretty informative numbers too. And, if you’re still reading at this point, can evidently write about it in some engaging fashion. I can tell you what’s going on from my own, unique point of view.

I feel the need to mention this so I can address this issue of “the numbers are all wrong so this is all B.S” which I see both publicly and privately. Sure… notwithstanding you’re not even a photographer, those shadows don’t look right and why aren’t there any stars in the background… clearly, the moon landings were faked. And here, give me the controls, I can land this plane. I saw it in a movie once.

These numbers are all we have, and, at present, they are serving us well. Some are straightforward. Some are inferred. Some are assumed. A lot of great minds are coming up with these numbers, and they’re in-line with what we’re experiencing. I can’t speak for the rest of the world, and I’m only going with what the credible sources tell us, but in general, those numbers are lining up with the associated experiences around the world. I am also, along with everyone else, waiting for the local emergence of a quick and accurate at-home serological antibody test… the test that will detect whether you’ve ever had the virus. And not just here. Everywhere. Actual science, not guesses and assumptions based on ignorance or hope. That will answer a lot of questions. That will verify the numbers. Or prove them all wrong.

Either way, until then, I’m going with the science.

View Original Post and All Comments on Facebook

Day 20 – April 5, 2020

When the historians who will ultimately document the great pandemic of 2020 begin their work, they will be asking themselves some tough rhetorical questions, many of which will begin with the words, “I wonder why they didn’t….” Indeed, some of those questions are being asked today, in the present tense, and good answers are not forthcoming. When those historians finish their books, most of them will have a chapter titled, “The United States of America”. Often, underneath the chapter name, there is a chapter subtitle… sometimes a little more detail, sometimes a quote. Usually in italics… you know what I mean. This particular subtitle will say:

“I don’t take responsibility at all” — President Donald J. Trump, March 13, 2020

Today is Sunday, “silent day” here in B.C., where the people upon whose words our futures (near and far) may depend, take a well-deserved break. Indeed, as loud as it gets at 7pm every night around here… it gets just as quiet at 3pm on weekdays when the only words you might hear are, “Shut up — Dr. Henry is speaking”. Today is their day off, so my B.C. number is just a guess bases on the averages of last week — I will fix it tomorrow when we get real data. But I’m guessing it’s pretty close.

Until recently, none of us had even heard of Dr. Bonnie Henry… but now, we all want to adopt her. And it’s not just the calm, soothing voice of reason that’s so enchanting… it’s the actual substance of what she’s saying. She’s not making it up as she goes along. She’s not up there to make herself look good. She’s not up there incoherently throwing blame around. She’s surrounded herself with excellent people who she consults on a continual basis. She’s not afraid to admit she was wrong, and, accordingly, she’s willing to course correct… which, if you read back on the evolution of this emerging pandemic in B.C., has happened more than once. She is, in every sense of the word, a leader.

On the day Donald Trump spoke those words, there were 2,300 known cases of COVID-19 in the USA. By that point, Italy was well aware they had a serious problem on their hands. They were at close to 20,000 cases and growing quickly, and they had begun throwing the proverbial kitchen sink at it in every feasible way. Pandora was out of the box, and the trajectory was not looking good. Everybody was paying attention, and everyone was making plans.

In Canada, on that day, there were 198 known cases, 64 of which were in B.C. If we were to map our growth rates to match what’s happened in the U.S., Canada would presently have 29,500 cases (we’re at 15,500) and B.C. would have 9,500 (we’re at 1,250 or so). And Italy, had they continued that same trajectory, would presently be looking at 26,300,000 — an unlikely number for other reasons, but that’s what the math implies if you leave this thing alone to propagate unchecked in an environment that could support that growth.

On March 13th, here in B.C., the only orders that were In place were that travellers returning need to self-isolate for 14 days, and that all gatherings of more than 250 people should be cancelled. Physical distancing as we know it today had not yet been implemented. And as we all know, a lot has changed since then… here, at least… not the least of which are the social distancing orders.

There are places in the U.S. at this moment where none of these sorts of orders are in place, and if they are, they are not being taken seriously or enforced. It boggles the mind to think that while we’re having a quiet Sunday here, there is a church in Louisiana where today 26 busloads of people arrived for services. People want to start talking about how we emerge from this, and it’s a complicated question because the world is a complicated place, where lots of different things are going on in lots of different places. The answer to how and when B.C. emerges from this will likely be very different than Louisiana.

B.C. has a population of 5 million. Louisiana has a similar population of 4.7 million.
On March 13th, B.C. had 64 cases. Louisiana had 77.
Today, we have 1,250 cases. Louisiana has 9,150.

What a difference real leadership can make.


View Original Post and All Comments on Facebook
Day 16 – April 1, 2020

I’m going to talk about antibiotics for a moment.

Important point number one: COVID-19 is a virus, not a bacterial infection. Antibiotics won’t work. Secondary complications that can arise, like pneumonia, are… and those would be treated with antibiotics… but if someone has told you that taking some antibiotic may prevent you from getting this virus, or might help treat it, they’re wrong. And if you’re taking some antibiotic for no reason, stop. Which leads me to point number two…

If you’re supposed to be taking antibiotics, there’s exactly one correct way to do it. When the doctor prescribes them, she will look you in the eye and say “Be sure you complete the entire course, till you’ve taken them all, till the container is empty.” That might be 3 or 4 times a day, and it might be a week or two weeks or 3 months. When you pick up the prescription from the pharmacy, the pharmacist will tell you the same thing.

The reason is simple, and we will use a simple example: War. I have an army of 100,000 and you have an army of 100,000, and we battle it out, and since my army is better than yours, I’m down to 20,000 men, but you are down to 50… and we have all you backed into a deserted building and we’re about to surround you and finish you off. But instead, for some silly reason, we decide we’ve already won and we’ll show some mercy, and we let you go. So off go your 50 men, rebuild their army, and in a few months, you come back with a replenished army of 100,000 and destroy me, because chances are that’s a much tougher group than the original 100,000.

Why? Because those last 50 out of 100,000 men were the toughest of the lot. They’re the real survivors, having made it to the very end. They’re the last people you should let go. They’ll go off and recruit and train equally-tough warriors before returning.

So, if you’ve got some bacterial infection, and let’s say you’re supposed to take a course of antibiotics for a week. To begin with, you’re feeling really awful, and you start taking them and guess what, it’s the perfect antibiotic for what you’ve got, and after the third day, you’re feeling fantastic. It’s all cleared up. Awesome. But ugh, taking these pills is so annoying. And you have to stay up so late or get up so early to take one, etc etc. You’ll just go down to two or three a day, what difference can it make. Maybe you’ll just stop.

What you’re basically doing is letting the strongest of the bacteria live on, re-group, and re-attack. Maybe not you, but someone else. And, worse than that, they might mutate a bit, be a bit more resistant to that particular antibiotic… and then, after that cycle has repeated thousands of times, you’re left with our present-day problem of drug-resistant bacteria that require a whole new suite of antibiotics, many of which have yet to be invented.

The relevant connection is to our present-day plight. The COVID-19 is the bacteria, and you and I are the antibiotic.

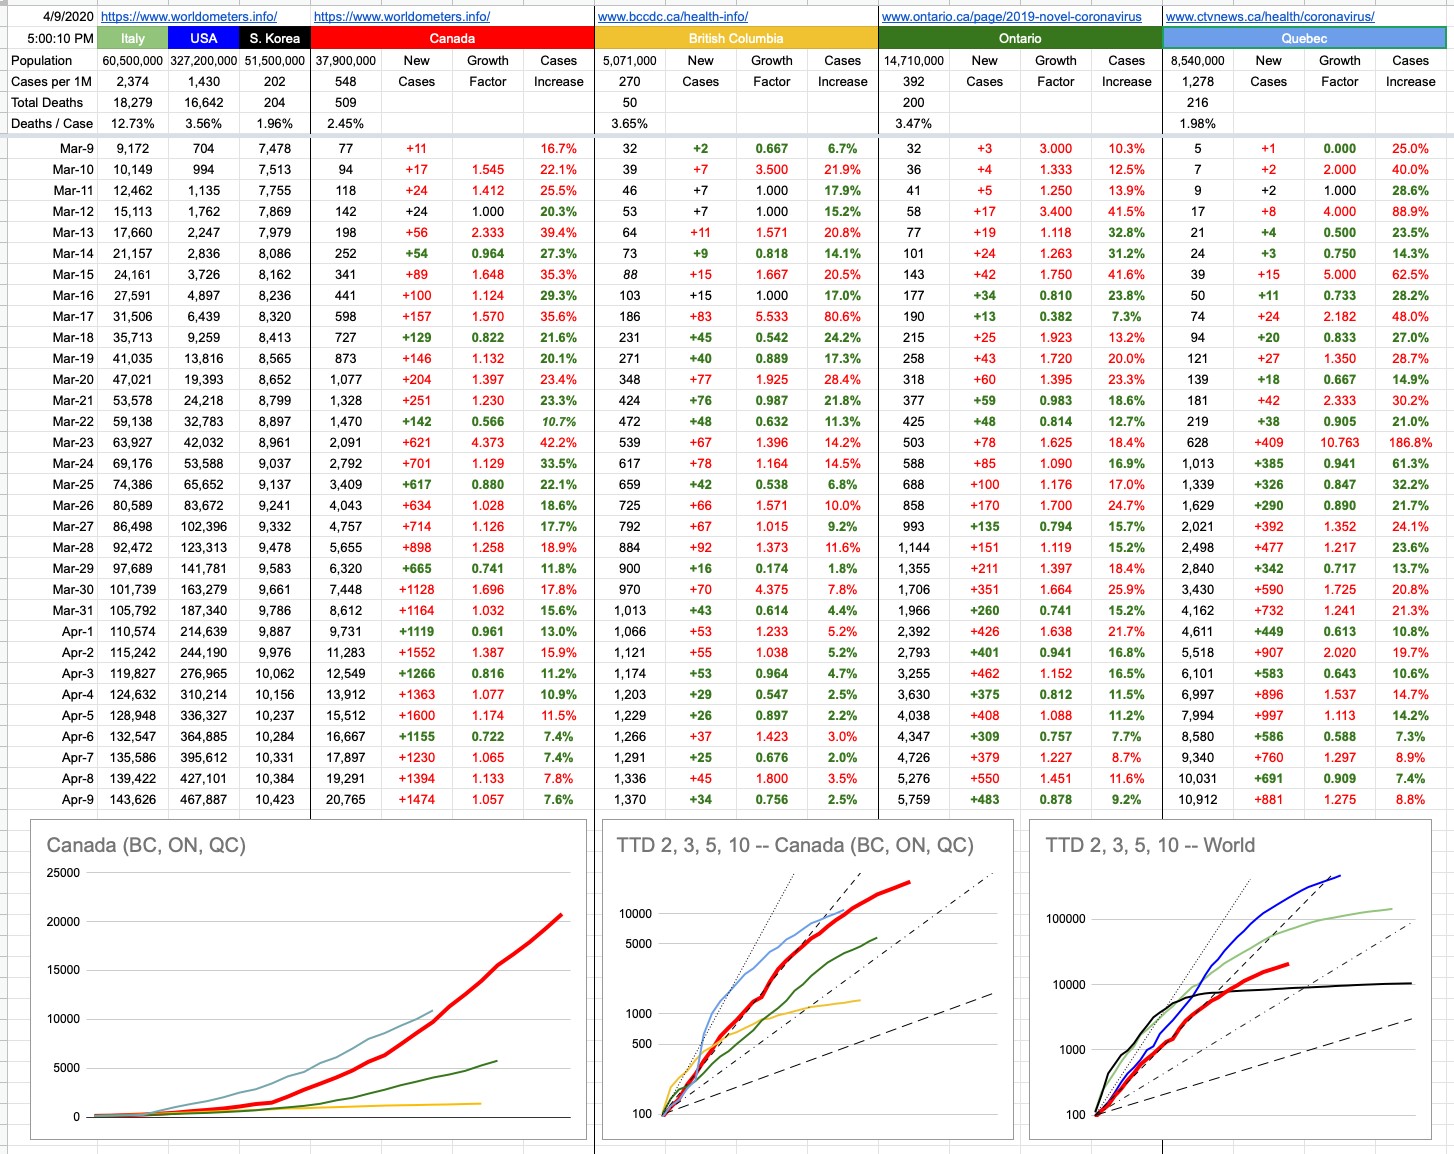
We’re on “day 3” of that “7-day” antibiotic course. Our social-distancing seems to be making a difference… but we’re not cured yet, and loosening up the treatment can quickly change the outcome. The fact it’s working is all the reason in the world to keep doing it properly.

I actually had another example… it involves the Canucks and the Bluejackets and allowing 4 goals in the 3rd period. But you know what, YouTube is full of videos… cyclists raising their arms in the air in victory as they approach the finish line, only to be passed at the very last minute. Or football players spiking the ball 3 inches before crossing the goal-line, fumbling the ball instead of scoring a touchdown.

The countless examples all point to the same thing, and by now I’m sure you get it: There is no victory until you actually cross the finish line, the game ends, the enemy is extinguished. Etc. Etc. Etc.

Keep taking the medicine… it’s working, but we’re not cured. And abandoning the treatment now could lead to non-victory, whatever that looks like. I don’t know, and nobody wants to find out around here… and for those that are not from around here, look around at the world at places where physical distancing has been implemented correctly, and its effects. And, even more to the point, look at where it hasn’t.

View Original Post and All Comments on Facebook
Day 14 – March 30, 2020

In Stephen Hawking’s remarkable book “A Brief History of Time”, he mentions in the introduction that he was advised that each formula he put in the book would halve the sales. Zero formulas, one million sales. One formula, half a million sales. Two formulas, a quarter-million sales. And so on.

By the way, that is exponential growth (well, decay, in that case). Which is what I’m going to talk about, but it’s also why I will try to include as few formulas as possible. Let’s stick to what’s important. Like, driving a car. Gas pedal, go. Brake pedal, stop. Steer where you want to go. That’s basically it, and you don’t need to understand the magic taking place under the hood to make good use of the car.

So, speaking of cars… let’s say you’re in your car, and you want to go from 0 to 100 km/h. My first car did that in about 18 seconds. My current car does it in 2.9. Both of those numbers are insane, but for completely different reasons.

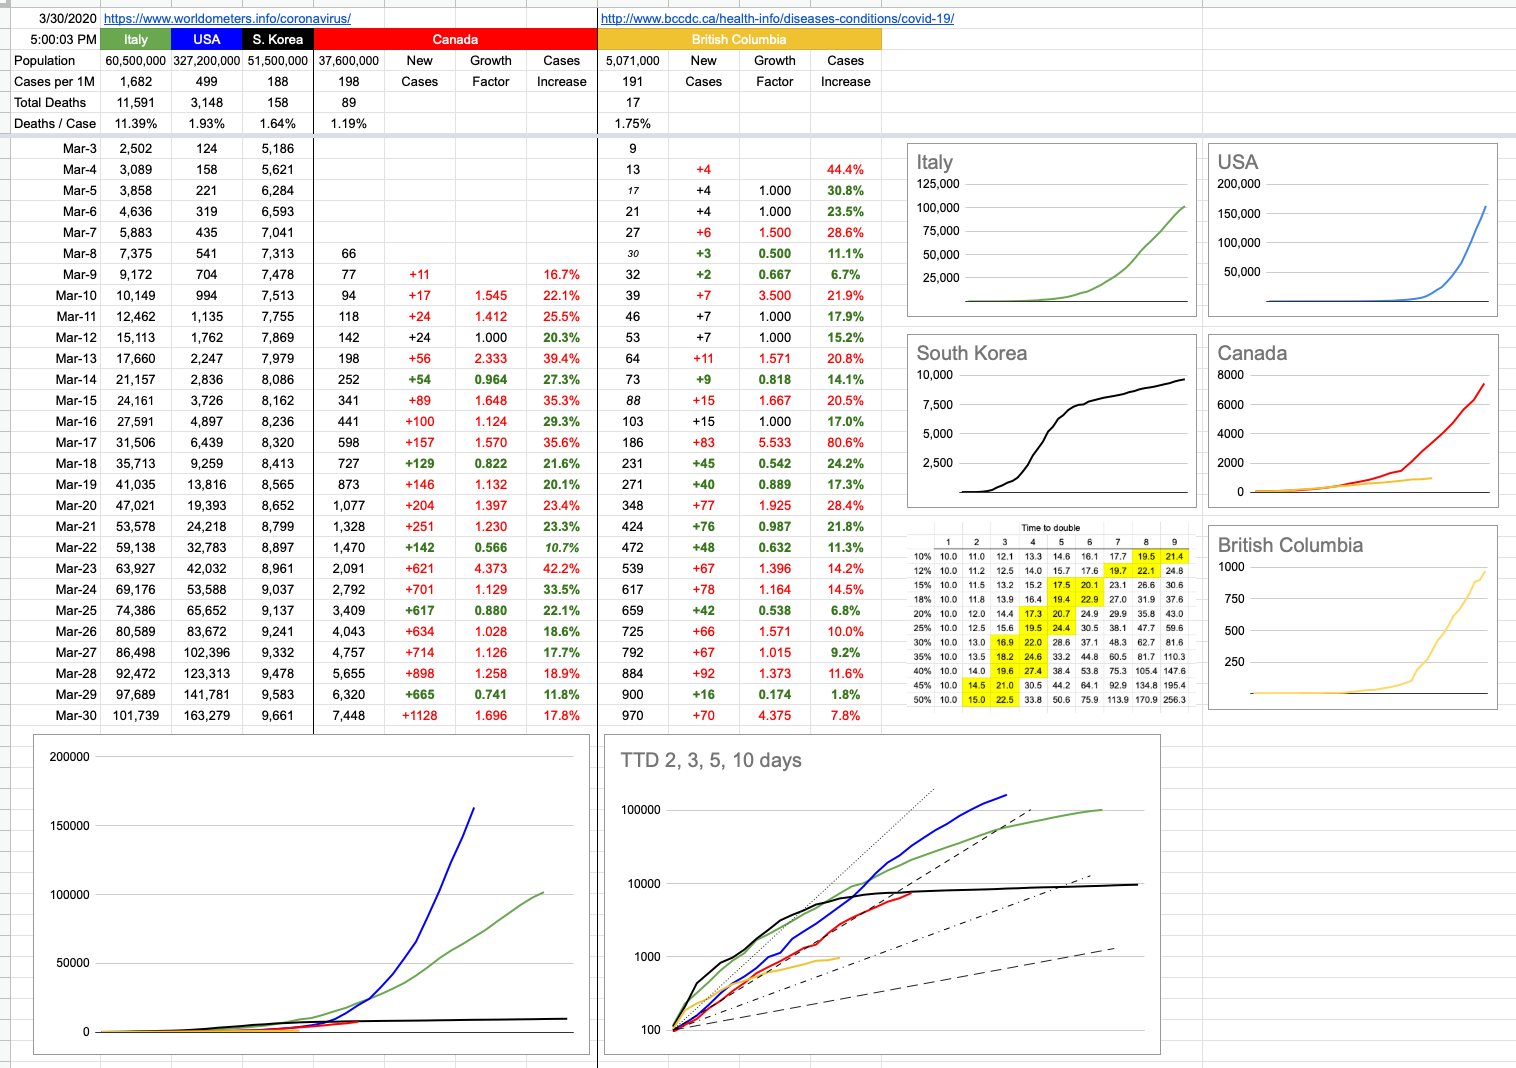
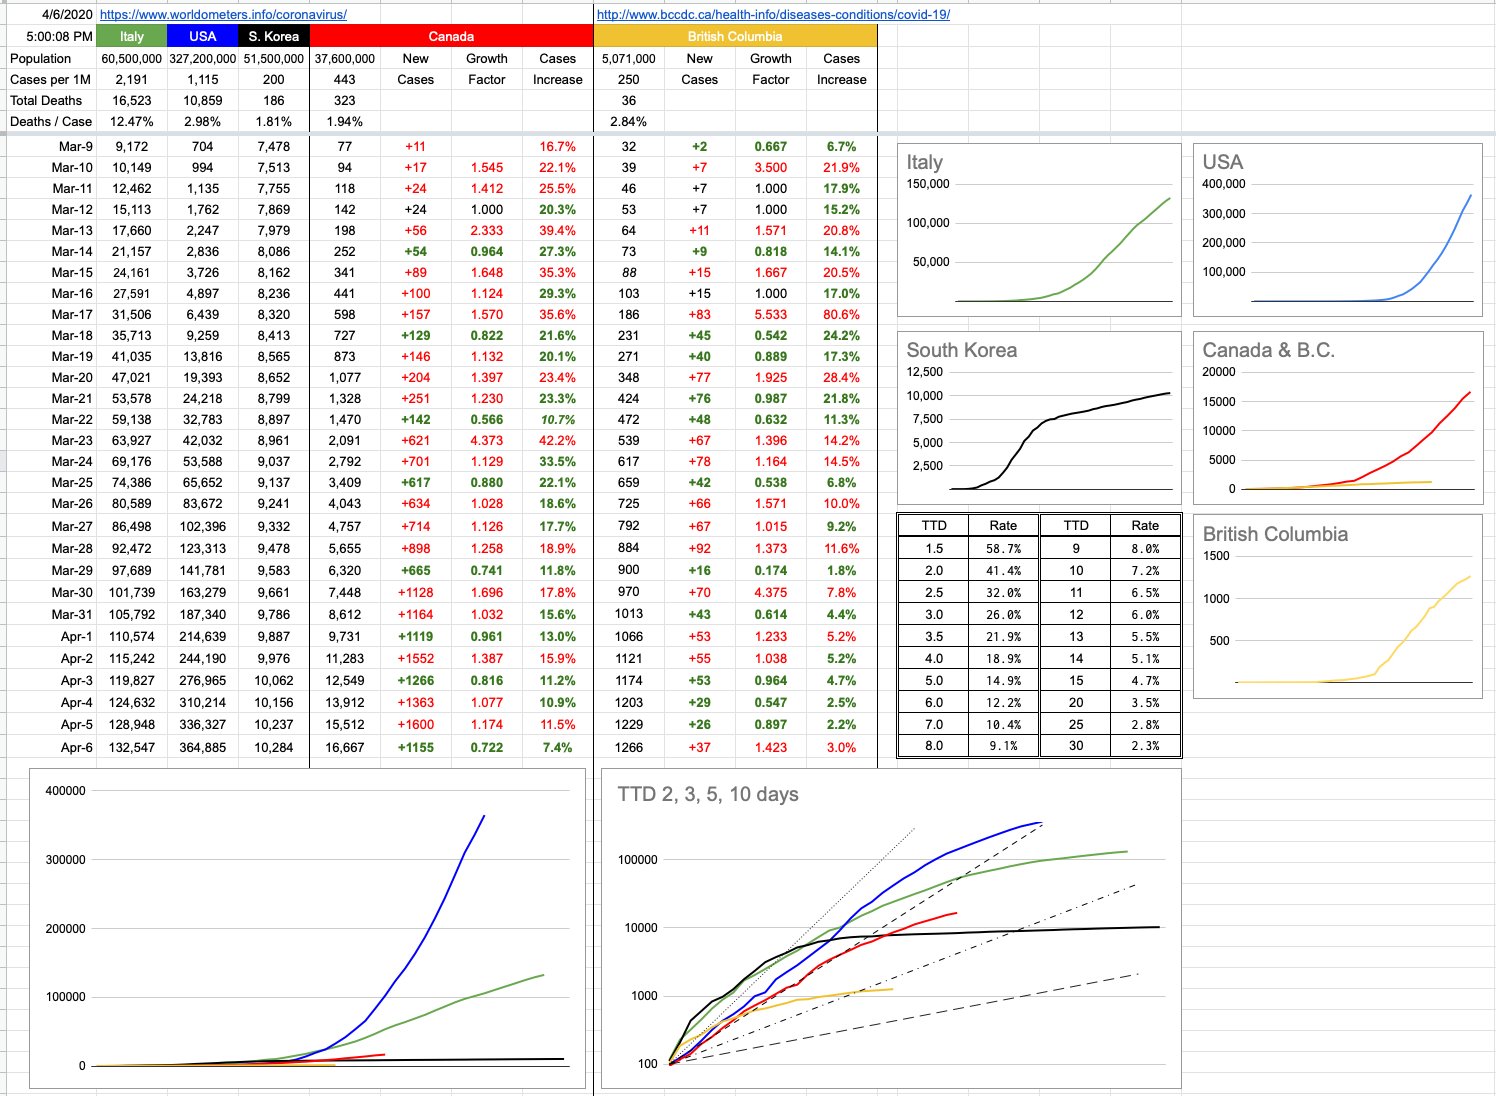
Let’s look at the new chart I’ve added, which is a logarithmic graph of all the same data… and some dotted-dashed lines I’ll explain below.

You car will follow an acceleration curve, which… interestingly, for a supercar like a Ferrari, will look a lot like the Italian line on the logarithmic chart. A more modest car, like a Kia, will look more like the South Korea line.

Ooohhh, wait a minute, we might be onto something here…

All cars eventually hit a top speed where they are no longer accelerating, and when they do, like the Kia/South Korea line almost has, it flattens out to a near-zero slope. That Ferrari/Italy line will flatten out too, eventually, but as we can see, at a much higher level, and it’s not there yet… but trending that way.

The Canada line has been skirting the left side of its attached dotted line, and is now a little on its right. What’s it most looking like? Thankfully, very evidently, not the MegaSupercharged Corvette/US line, whose pedal is still floored and heading to a scary top speed. Whether Canada trends more like South Korea or Italy depends to be seen. Eyeballing it would imply somewhere in between. The math implies something similar. The reality remains to be seen with what happens in the critical next couple of weeks as the incubation window vs. social isolation window overlap winds down.

When I started doing these daily charts, which seems like years ago, but it’s actually only been a couple of weeks, my intention was to provide an apples-to-apples comparison of how we were doing vs. other countries, especially the US. We were roughly 10 days behind them, and they were roughly 10 days behind Italy. And I threw in South Korea so we’d have a good target to aim towards. There were the original little charts showing each country independently, to illustrate what their curves looked like, and the consolidated chart of all of those on top of each other at the same scale. And then I added B.C. because it’s behaving a little differently than the rest of Canada, and most of the people reading this (including me) live there.

I am not going remove any of that, because they’re still interesting to look at, especially if you’ve been following it from the start, but the scale of the numbers and the squashing effect renders the visuals less useful than before. You can zoom in and definitely see the red line detaching from the blue one. You can definitely see the yellow line detaching from the red one. But as time goes on, it’ll just turn into a thick purple line.

Which leads us to the new graph I added today, one you’ve likely seen elsewhere… a logarithmic representation. This one is a little cleaner because it only has my 5 data lines…. and 4 dotted-dash lines, which refer to a topic I brought up yesterday, and have everything to do with the rate of acceleration — the Time To Double. The steepest of those lines, the smallest dots, is a TTD of 2 days. The next one over, that the Canada line is riding and now hopefully falling off of, is a TTD of 3. Below those are TTDs of 5 and 10.

There is no magic number as to what’s good… the bigger the TTD, the better. The more manageable things are. The less the avalanche of cases.

Fun fact… do you remember in school, where some of you hated math, and argued with the teacher that you’d never in a million years need this in the real world… well, haha, guess what, what we’ve been talking about here is differential calculus, and the acceleration we’re looking at is the first-order derivative of these graphs and their data. And the rate of change of that acceleration is the second-order derivative.

Hey, sit down — I promised, no formulas. There’s no test. But… now you have some understanding at what it is the experts are looking at closely, and, in many cases… worryingly… the rate of change of the acceleration. And its implications with respect to time to double, and the planning and contingencies that needs to be in place for those different scenarios. When they talk about flattening the curve, this is the graph to which they’re referring. And in a perfect world, all of those lines start flattening-out to the right. I’d much rather be writing about rates of deceleration.

One day…. hopefully sooner than later.

View Original Post and All Comments on Facebook
Go to Top