Alberta

November 22, 2020

We’ll have to wait till tomorrow to see some B.C. numbers, so until then, let’s shift our attention eastward by one province and look at Alberta, who unfortunately is giving us a textbook example of what exponential growth looks like.

For today, I’ve added a third row of graphs. The top row of the three is each province’s journey through this pandemic, from day one. The bottom two rows represent only the 2nd wave; first, logarithmically… and, the bottom one, normally.

They say a picture is worth a thousand words, but sometimes, it’s not because the picture is so indescribably beautiful… but because the picture is difficult to describe. If math isn’t your thing, hearing a sentence like “the plot an exponential curve on a logarithmic scale will be a perfectly straight line.”… might sound confusing. But when you look at the pictures, it makes perfect sense.

Have a look at Alberta, and have a look at the bottom two graphs. They are displaying the same dataset, but on the bottom one, the Y-axis is linear, ie normal, ie… perfectly spaced out. The one above it is logarithmic, which “squashes” the Y-axis the bigger it gets.

The way a logarithmic scale works is that it perfectly compensates for that exponential growth… which is why those smooth, increasing curves of the bottom graph (TTDs of 20 and 25) show up as perfectly straight lines on the graph above it.

Accordingly, the seven-day moving average of daily case-counts of Alberta, the thicker black line, follows the curve on the bottom graph and follows the straight line on the upper graph. While the logarithmic graphs tend to minimize the growth as things get worse (the steepness gets squashed), the real-data graphs tell the truth. It’s clear from looking at these graphs exactly where Alberta is heading, if things don’t change. It’s clear as well that Saskatchewan’s recent increases are far worse than TTDs of 20 or 25; closer to 15 over the last few days.

Exactly 8 months ago, we were heading into the last week of March wondering the same thing we are today… I wonder what the week ahead will look like. It feels like a lifetime ago, March 22nd… that was the 6th day of me writing about all of this (here it is if you’re interested: https://kemeny.ca/2020/03/22/march-22-2020/). The U.S. had 32,000 cases. Canada had less than 1,500. B.C. had less than 500.

Here we are today (Day 251) – and the sentiment hasn’t changed. Just the numbers, which are all a lot bigger.

Follow & Discuss on Facebook

Day 250 – November 21, 2020

No B.C. numbers today, but here’s a brief look elsewhere…

Parts of Ontario (Toronto and Peel) are in a lockdown of the sort we saw around here at the start of this pandemic. Very tight constraints with respect to with whom you can get together, and strict rules around what that needs to look like. Everything else is pretty-much closed, except the essentials.

Saskatchewan saw a huge increase in numbers today, something they saw coming; measures were put in last week, but they’re now dealing with the effects of what came before. As we know, it can take a couple of weeks to realize the effects of these measures.

Alberta also set its record for new cases in the last 24 hours.

Today’s lesson in exponential growth comes from Nunavut… where, for the longest time (like till November), they’d seen zero cases. They got their first one Nov. 6th… their second one Nov. 7th… and then two more Nov. 8th. Then 8, 18, 26, 60… and they’re now over 100. Their graph is not a gentle slope or a hockey stick… it’s a literal cliff wall which they slammed into, after 7 months of flat road. That’s how this thing can take off.

In the spring, it was all about flattening the curve. For those late to the game, like Nunavut and Saskatchewan, where they never got a first wave, that’s where they’re at.

For places like Ontario and Quebec, it’s not just about flattening the potential frightening growth… it’s that the numbers, as flat as they may be (which they’re not) are already really big.

What’s worse… if you have 100 hospital beds available… to see cases go from 2 to 8 to 20 to 50 in a few days? Or to see them go 98, 99, 103, 98?

The answer is… it depends… on what measures are in place. Drastic measures are needed in example A, but example B is just as frantic, because it’s evidence of a problem that’s stressing the limits and that’s not going away unless something is done about it. Roughly speaking, example A is Nunavut and example B is Ontario.

The rate of growth is interesting to look at, on an apples-to-apples basis. I’ve added Time To Double (TTD) lines to the provincial graphs, and I’ve set them all (for now) to 20 and 25, so you can compare the data against those straight lines… and across provinces. Don’t worry too much about where those lines cross, just look at the slope of the data compared to the TTD lines. B.C. and Alberta are examples of consistent growth… you can see the recent growth is virtually parallel to the TTDs of 25. And at their steepest recent points, both Saskatchewan and Manitoba had recent TTDs approaching 10.

You’ll notice that Quebec and Ontario are a lot flatter. Indeed, their TTDs are 50 and 77 respectively. Their issue isn’t so much exponential growth… it’s just that any growth is already putting pressure on a system that at some point won’t be able to handle it.

Follow & Discuss on Facebook

November 6, 2020

To follow-up briefly on yesterday’s poker analogy… we’re at the point where Joe Biden went all-in, and Donald Trump, hesitatingly, called… so Joe flipped over his cards; what’s colloquially known as “the nuts” — the unbeatable hand, because there’s nothing left to deal that can change anything. Trump is drawing dead, and can only helplessly watch the hand play out.

Normally, a player in Trump’s position would realize he’s beaten, flip over his cards, and watch the chips get dragged over to the other side of the table. But, of course, Trump is trying to bluff an unbluffable hand. Perhaps at some point, his fans cheering him from behind will be able to convince him to just face the fact that he lost, and move on. But it’s doubtful. Many of them continue to cheer him on blindly.

Notwithstanding that this may end up being a bigger victory for Biden than was originally thought a few days ago, there are a lot of posts from people wondering how it’s possible that a misogynist racist narcissist whose policies have further divided a country the desperately needs unity – not to mention his abhorrent handling and messaging of this pandemic – could have received so many votes? There are many takes on it, but it boils down this…

First of all, some simple math… rough numbers, some 144 million people voted. Of those, there is an unshakable core of Republicans who’ll vote that way no matter who the candidate. How big is that core? It depends how you measure it. Here’s a rough breakdown of Trump voters:

American Preservationists (20%)
Staunch Conservatives (31%)
Anti-elites (19%)
Free Marketers (25%)
Disengaged (5%)

Within that breakdown, there are probably 40% who won’t be swayed, no matter what. And 40% of 144 million is around 57 million… so really, perhaps it’s only 13 million who “really” voted for Trump… and the vast majority of those are white men, and it must be noted that the urban voter turnout is what probably made the difference. The People Of Colour… Blacks, Latinos, Indigenous peoples… they showed up. In person, waiting hours to vote… or mailing it in… however they did it, they showed up. It’s no surprise that even in many Republican states, the big cities are hubs of blue votes.

On the flipside, the rural areas, many of them populated by people with very different priorities… Immigration, jobs, terrorism, the economy, national debt. Who cares if the leader is a jerk? These are the things that matter to me, end of story. My house and my job and my gun… mean more to me than whatever is going on elsewhere. Any by the way, for many people who’ve never left their own state, let alone country… “elsewhere” is everywhere else that’s not within driving distance. They couldn’t care less what’s going on in Portland or Kenosha.

While Biden got more votes than any presidential candidate ever, in second place is Donald Trump. His seventy million votes is what Obama got in 2008 when he crushed (365 to 173) John McCain. It should be noted that four years ago, when Trump beat Hilary, it was 304 to 227. And this was viewed as a huge victory, a demographic shift, a fundamental realignment, etc. It’s looking like Biden will wind up with almost identical numbers. So while it’s not a Blue Wave many hoped for, let’s not discount the inherent statement being made: No more Trump – spoken quite loudly.

The voting system may need a bit of thought, but there are no easy answers. It’s hard to fix it when there’s no agreement with respect to what’s broken. One thing about the electoral college system is that without it, given how fractured the country is, you might not see a Republican president elected again for a very long time. Biden is ahead by 4 million votes, but Hilary was ahead by 3 million and lost. In 2000, Al Gore won the popular vote by half a million and lost. In 1960, JFK crushed Richard Nixon 303-219… but won the popular vote by a ridiculously small margin, like 100,000 votes.

The sad truth is as that the chasm gets wider, like the rich get richer and the poor get poorer, the popular vote gap between Democrats and Republicans will widen… and that will, at least for the foreseeable future, be reflected in the left-leaning popular vote. Biden has his work cut out for him; he’s inheriting a mess on every level. I hope he, and the excellent people with whom I hope he surrounds himself, are up to the task.

A final, unrelated note… when I started writing these daily thoughts 235 days ago, it was supposed to be exclusively a daily update of C19 numbers and perhaps a paragraph with respect to where things are. It started to turn political when my daily research of what was going on south of here went from surprise, to incredulity, to anger, and all of it directly pointed at Donald Trump.

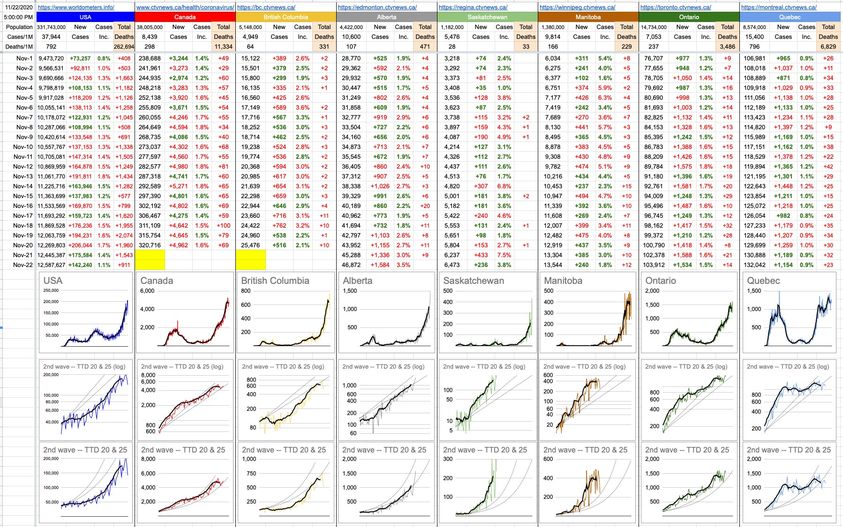
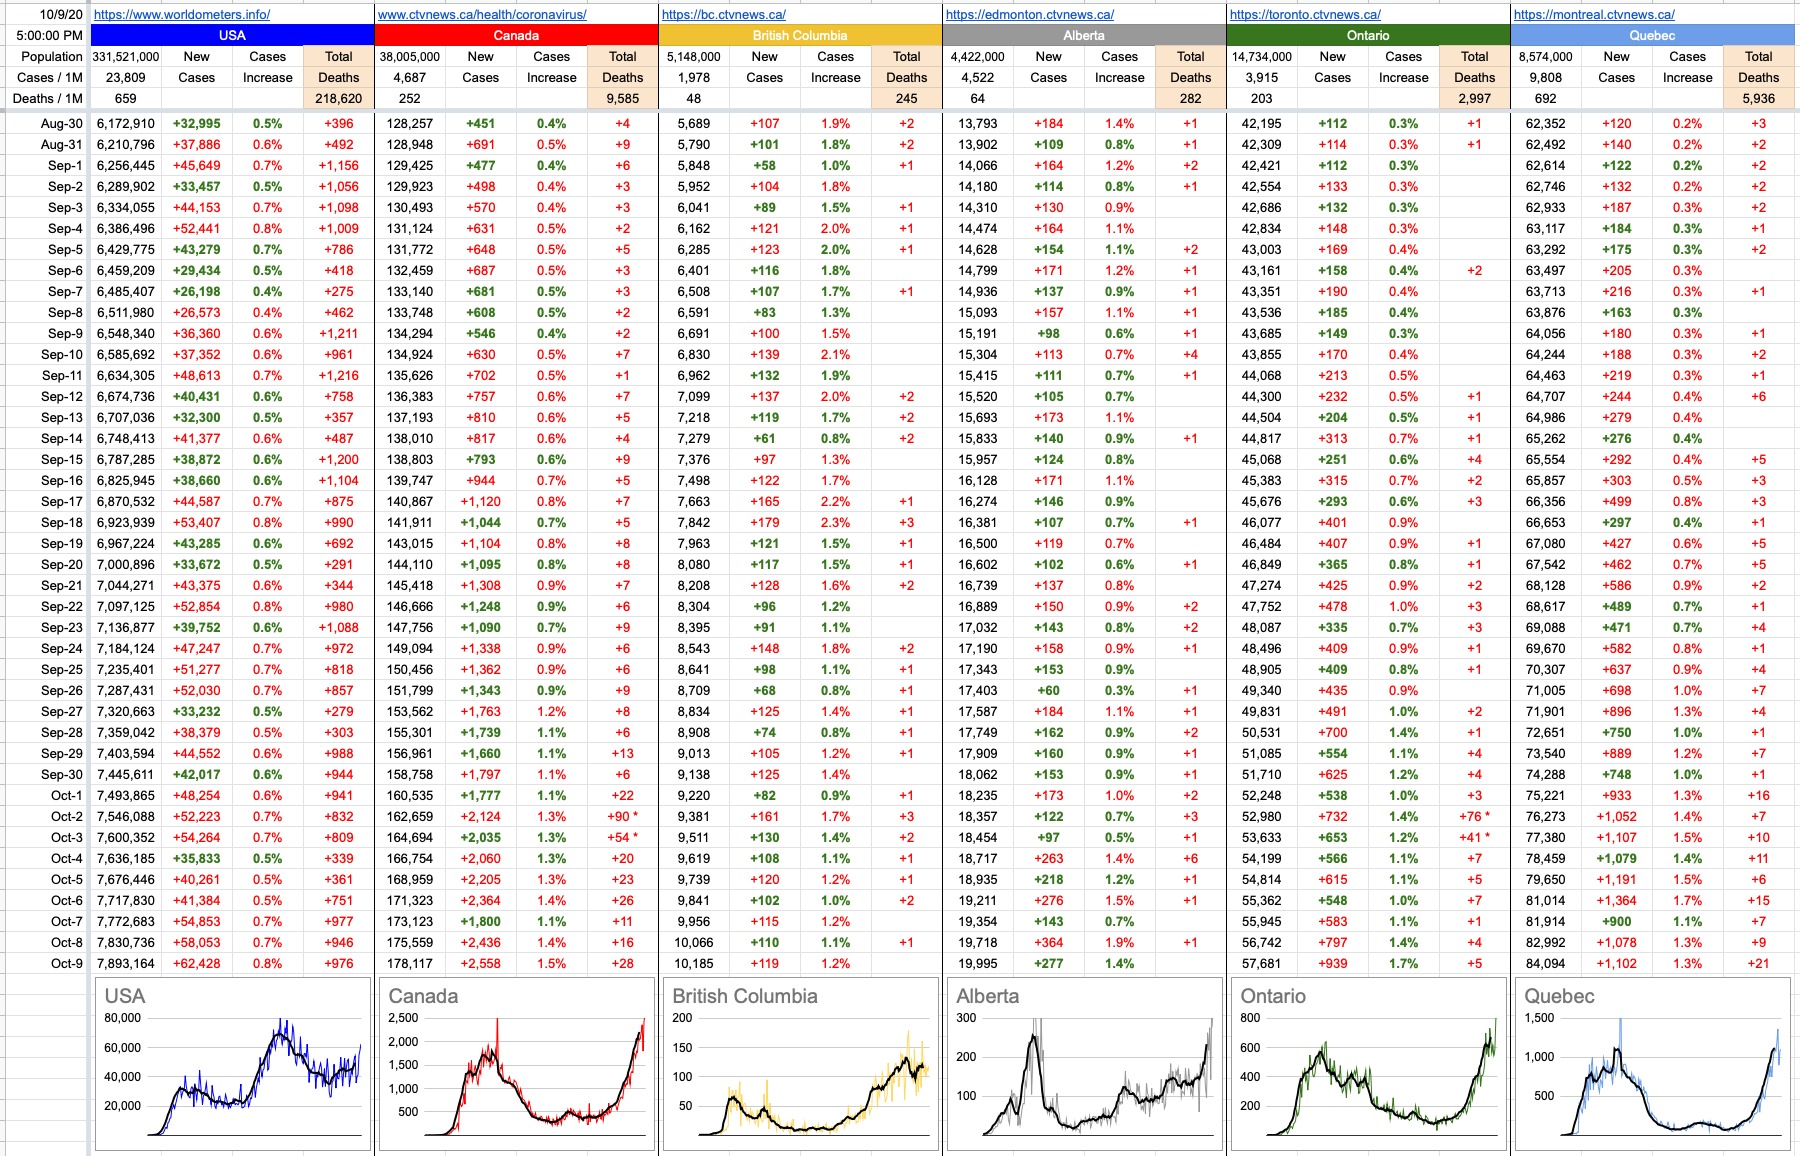
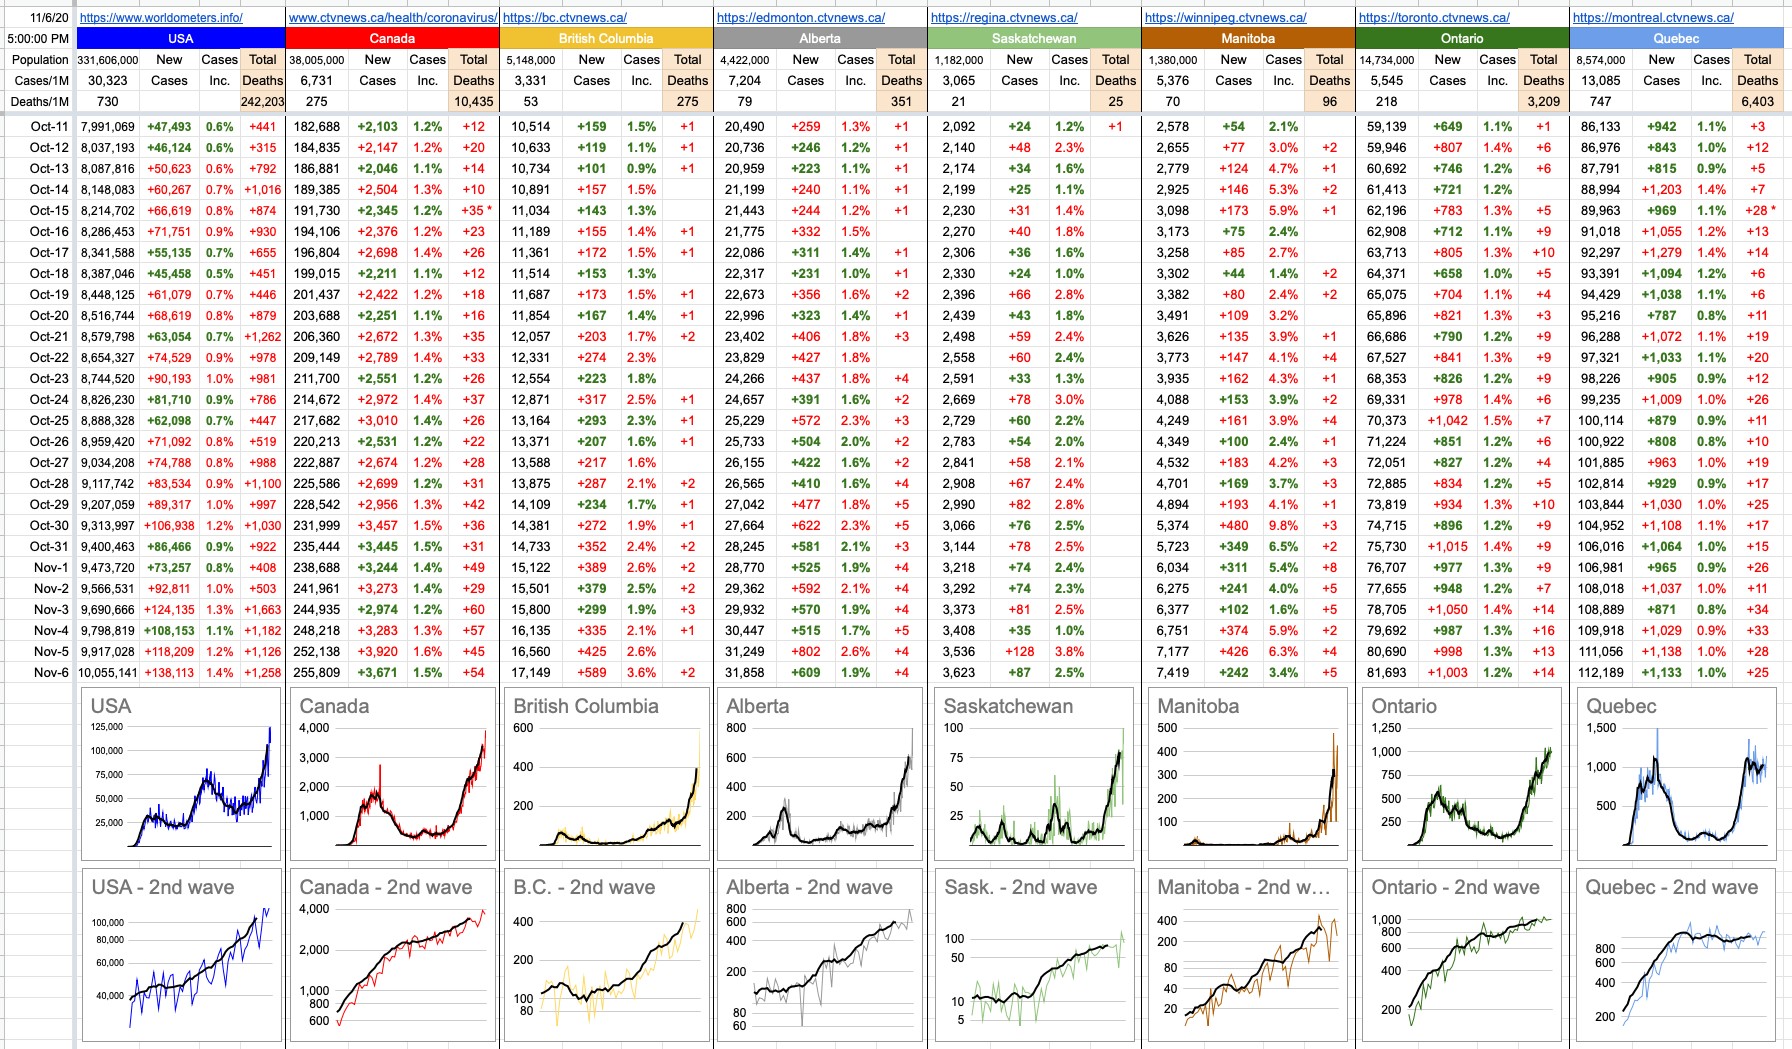
With him on his way out, and hoping Biden and his administration start taking things seriously, the daily bashing of American politics will be far less frequent. We have more important things to worry about. Here in B.C., almost 600 new cases in the last 24 hours… and I unfortunately know one of those people. Also, more than 600 in Alberta. And in Ontario and Quebec, more than 1,000 each.

The U.S. has its stuff to fix… they quietly reached 10,000,000 cases while all of this has been going on… but here, north of the turmoil, we have ours.

HK COVID-19 Daily Report - Graph for Nov 6, 2020

Follow & Discuss on Facebook

October 30, 2020

You’ll notice below that I’ve added Saskatchewan to the numbers and graphs. While their absolute numbers aren’t looking too bad, their trend isn’t great… and, unfortunately, they’ll soon be a relevant part of the national picture. But what’s worse is that they’re sandwiched between Alberta and Manitoba, and looking at how things are going in those two places, it’s starting to turn that corner from concerning to frightening.

Let’s recap a bit, starting with the fact that a Covid-19 infection takes up to two weeks to kick in, and that Thanksgiving in Canada was a couple of weeks ago. What effect was there from everyone who somehow thinks they’re above getting sick or being infectious or “having their freedom taken away”? To hell with this hoax, it’s just a flu, it’s just the government trying to control us, etc etc. Let’s get together and celebrate; it’s no big deal.

Listen… I don’t mind being that guy, the one that you consider to be nagging or preaching or whatever. Standing on my little soapbox, inciting panic by spewing the government lies. Telling you what to do like I’m holier than thou. Maybe that’s the way you see it.

I really don’t care how you view this message… but, to be clear, I’m no different than you – I can get just as sick and infectious as anyone else. I’m trying hard to avoid becoming either of those things, but, evidently, many of you are not trying as hard. Here it is again, in the plainest English possible: if you don’t wear a mask when you should, and if you don’t socially distance, and if you don’t wash your hands and sanitize and do everything you’ve heard 1,000 times from everyone around you that understands the implications of not doing so, this thing will spread. And it will spread exponentially. And we will *all* suffer as a result.

Last three days in Alberta: +410, +477, +622
Last three days in Manitoba: +169, +193, +480

Winnipeg will soon be starting a full-on lockdown; shutting it all down till this can once again be brought under control. The tipping point is unfortunately near, with ICUs at over 90%. When you spill past 100%, that’s where you have patients in hallways, in lobbies and out in the street, dying. Listen to first-hand accounts from ER doctors… pleas of despair from places like Italy, Spain and New York, when that’s what happened. And that was in the spring… let’s not try to imagine what this looks like when it’s 25 below zero… as it’ll be in Calgary, Edmonton and Winnipeg in the not-too-distant future. Yes, in the past, this was far away… the other side of the Pacific, then the other side of the Atlantic, then south of the border. It is now knocking on the door… “it” being the point of no return.

Sure, call me alarmist. Feel free to point fingers back at me and laugh in a few months when the world didn’t fall apart. Don’t worry, I can take it. And, if in any small way, getting this message out actually helped prevent that emerging disaster, great. I guess we’ll never know; I don’t care. I’ll happily join in your mask-burning bonfires, happily admitting I was wrong… even if perhaps I wasn’t. But that’s not the point… the point is, we can’t afford to be wrong in the other direction.

Follow and Discuss on Facebook

October 25, 2020

Like the NDP in B.C., COVID-19 is back for a 2nd term… and it’s more powerful than the first.

I’ve added a new series of graphs… these are a subset of the graphs above them, and plotted logarithmically… starting at a good guess with respect to the beginning of Canada’s 2nd wave – right after Labour Day.

Since they’re logarithmic, they tend to squash the numbers… but that’s useful, because it tells you at a glance when the growth has stopped… like when the new-case numbers are linear, not exponential. Indeed, if you look at Quebec, the bad news is that they’re getting 1,000 new cases a day. The good news is that those numbers have been steady for a couple of weeks. Don’t get me wrong, 1,000 cases a day isn’t great, but it’s far, far better than the implication of seeing those numbers continuing to rise sharply.

Which brings us to everyone else… where, across the board, every other province is edging upwards. That part is expected. How steep and how long… that remains to be seen. We’ll see what B.C. and Alberta – and therefore, the national picture — looks like tomorrow.

October 25, 2020

Follow and Discuss on Facebook

October 21, 2020

You’ll notice some new columns and a new graph today… please join me in welcoming Manitoba to the club.

Manitoba has had a bit of a different journey with respect to the pandemic. Like the rest of the country, things shot-up there in late March and early April… but then got flattened out very effectively. They flared up a bit again during the last week of August, but again they managed to stamp it down. More recently, in the middle of October, they had a pretty bad three days. Where it goes from there remains to be seen. After that spike, it looked like it was tailing off again… but the last couple of days don’t imply a good trend. Either way, now we’re keeping an eye on them as well.

Note to Saskatchewan, The Maritimes and everyone else… I hope you remain insignificant enough that you’re not worth mentioning here. Numbers are creeping up everywhere, including places that haven’t seen cases in a long time. The Yukon reported two new cases a couple of days ago; their last new case had been August 7th. And the Northwest Territories… one new case yesterday, two more today. It’s the first time since April that they’ve seen new cases.

Around here, B.C. saw more than 200 new cases today… the first time it’s ever been over 200 in a 24-hour period.

Similarly, in Alberta… but the number there is 400+. Ugh.

The top Canadian prize still goes to Nunavut… they’re still having none of it.

October 21, 2020

Follow and Discuss on Facebook

October 9, 2020

If there were any doubts about there being a second wave here in Canada, that question seems to have been answered. We’re no doubt in it, and the question that remains is how bad might it get.

This is a big country… from here in Vancouver, St. John’s is not much closer than Tokyo. That’s a lot of space, in which the 38,000,000 of us are all navigating this journey differently.

Heading into the weekend… yesterday, B.C. crossed that “10,000 cases” line. Alberta will have crossed their 20,000 line by the time you read this. Comparatively speaking, Quebec has seen 10,000 new cases in only the last 10 days. Ontario will see its 3,000th death tomorrow.

As we head into this rainy weekend, I don’t have much more to add for today, but one thing… we won’t get updated local stats till Monday, and while I used to do some fancy math to extrapolate/guess what might be in store, I think I’ll back off from that. This isn’t a math exercise; each stat is a real person somewhere, just like you and me.

And wishing every one of those people a good start to this Thanksgiving weekend.

View Original Post and All Comments on Facebook

October 6, 2020

We’ll keep the Trump-bashing to a single paragraph today… just to point out that Donald Trump, once again putting himself ahead of anything that might mean something important to anyone else — because callously and recklessly putting at risk and/or infecting everyone around him isn’t enough — called off the stimulus package talks… really, for no other reason than to stick it to the Democrats and make them, and Nancy Pelosi, look like the bad guys. It was a move that caught even his fellow Republicans by surprise. So who’s affected? Millions upon millions of Americans whose lives have been devastated by C19 and who are seeking some economic relief out of the mess… from the president that led them into it.

I’d like to briefly compare that to what’s going on around here.

Last week, the House of Commons voted on bill C-4, to replace CERB with something more robust… to add more flexible and generous aspects to employment insurance. To add a new benefit for those who don’t qualify for EI. To add a sick-leave benefit and caregiver benefit for those who need to take time off work, due to C19.

The Liberals proposed it, and the Conservatives and NDP and Bloc all had issues with it. They all argued and postured and threatened and made lots of noise. And ultimately, having discussed it and re-aligned and addressed their concerns, voted on it… where it passed, with a unanimous vote of 306 to 0. Welcome to Canada.

As much as you may disagree with the Liberals and a lot of what they do, let’s at least recognize that we’re fortunate to have a functional government. There’s a long list of countries around the world that are not so lucky. One of them is next door… hopefully a situation that doesn’t last much longer… 28 days, or 106 days… depending how you look at it.

Local government financial help aside, it’s still up to us to do our part to end this nightmare sooner than later… and Quebec’s health minister is pleading with people to stay home, if they can… because things are approaching a frightening tipping point. Since Oct. 1st, Quebec has averaged more than 1,000 new cases per day… and has recorded 49 deaths. In fact, their deaths per million of population is 691, which is higher than the U.S’s 651. For comparison, Ontario is 203, Alberta is 65 and B.C. is 48.

It might be time for some official harsher measures; a gram of prevention is worth a kilogram of cure.

View Original Post and All Comments on Facebook

October 1, 2020

I just got back from the track a few minutes ago (it’s closing day of a very memorably-odd 25-day season… but it was great to see some familiar faces), where I watched my horse “Blueprint” run 2nd in one of the most prestigious races of the year… so that’s good. But that “2” is about the only good number around.

Canada, today, saw its 160,000th C19 case… and recorded 22 deaths, the largest 24-hour total since July. When you look at the chart below, at the Canadian growth numbers, you’ll see them all above 1% over the last 5 days. And if you look further back, you’ll see them all below 1%… going all the way back to May. We slowed it down from the end of May onward, and now it’s crawled back… and, if you look at the corresponding graph, it’s crawling rather steeply.

It’s interesting to look at the trends of the other charts, too. Notably, B.C., which briefly looked like it was going to spiral out of control… hasn’t. Things have tailed off recently. That meteoric rise has slowed and backed off. Maybe Dr. Henry managed to scare us back into order.

Alberta is fighting to keep its growth flat, and while things could be better, they could also be worse. They’re fighting to keep their spread in schools under control, and it’s not looking great; let’s hope for the best.

So what’s driving this national growth? The usual, of course… Ontario and Quebec… who both, at some point, were looking to have things well under control. Not anymore. The numbers, the graphs, the deaths; none of it is good. Everything sliding in the wrong direction.

My horse “Blueprint”, to be honest, is probably not destined for greatness. He really stepped it up today and I’m proud of him… especially because there’s only so much you can do. Our very excellent trainer Dino does what he can to prepare the horse, but once the starting gate springs open, anything can happen.

Similarly, the national blueprint for handling a pandemic requires the involvement of everyone. The trainer does what he can; the jockey does what he can. But it’s ultimately up to the horse… and horses, like people… they can be stubborn.

You can lead a horse to water… you can even jam his face into it and hold it down… but if he’s stubborn enough, he’ll drown before he’ll drink any. It doesn’t make any sense. But neither does not sticking with a blueprint that’s been shown to work.

View Original Post and All Comments on Facebook

September 21, 2020

Dr. Henry’s “back to school” ad rubbed a lot of people the wrong way, and I was one of them. It painted a completely unrealistic picture of what classrooms would look like. As any student or teacher or parent (of either of those) will tell you, most classrooms have more than 6 kids and most classrooms don’t have a sink for convenient and frequent handwashing. The explanation given was that it was simply a setting for Dr. Henry to be explaining things to a group of kids; it didn’t necessarily represent the norm. They could’ve shot that ad outside or in a gym or in a playground or wherever, but they chose to talk about classrooms… in a classroom – but a classroom that doesn’t actually look like what classrooms will look like. Hmm.

When I was in school, the most frequent thing from teachers was “Settle down” or “Be quiet”. Until recently, it was “Get off your phone”. These days, all of that has been replaced with “Put on your mask”.

Seeing some of the pictures my kids are sending from school (both are in high school), it seems one thing hasn’t changed; a lot of kids aren’t great listeners and will do whatever they want.

In another sort of horse race that nobody wants to win, the province of Alberta has recorded more than 100 school outbreaks, and they’re growing quickly. B.C. is presently at around 20. For comparison, as of a few days ago, Ontario had seen around 90 school outbreaks… and Quebec, around 270.

Interestingly, a few minutes after I signed and submitted some forms promising to keep an eye out for symptoms in the kids before sending them off to school, the B.C. Ministry of Health removed more than half the symptoms, among them sore throat and runny/stuffy nose. To be clear, the directive is this: IF you are a kid and IF you have only that symptom… sore throat and/or runny/stuffy nose – chances are, you’re ok.

I get it, and I don’t get it. It’s a tough situation. As anyone who has kids (or has ever been a kid) knows, every single kid at some point between now and March will have a sore throat and/or runny/stuffy nose. All of them. And, for the vast majority of them, it will not be C19. They certainly never were in the past. Yet, almost certainly, some will slip through the cracks and there will be outbreaks. And then what? I guess we’ll find out. And it’s not an “if”; it’s a “when”.

Speaking of “not if but when…”, our numbers aren’t looking great. Not just here, but AB, ON and QC as well. Looking at these little graphs, it’s pretty evident. Those 7-day moving averages, from across the country, are not encouraging. I’m not saying we’re beginning a second wave, but if we were starting one, this is exactly what it’d look like.

And a final “not if but when”… John Horgan just called a Provincial Election. Funny, I was recently having this discussion with someone, pondering whether an election would be called sooner than later. Although, purely (and only) for political reasons, it makes some sense now… I thought they’d hold off. Because, by the exact same token, the NDP is going to face an enormous backlash. People have far more to worry about in the next month than this… and the very tenuous balance-of-power held by the present government could end up swinging in a different direction.

Be prepared to hear a lot more about this… #infectionelection

View Original Post and All Comments on Facebook

Go to Top