Day 60 – May 15, 2020
“Collect as much data as you can for now.” — this is a mantra that is common in many different disciplines, especially the ones where you’re not sure what data matters. One day, you’ll have a chance to look back on it and figure out what matters, but for the most part, especially initially, the thing to do gather as much as you can, and eventually learn from it.
“Eventually” could mean decades from now. It could also mean tomorrow. In fact, it could even mean 15 minutes from now. On that note, as you’re reading this, somewhere, on the periphery of your focus, there are ads and sponsored posts and other slight differences that are being thrown at you; an experience that will differ slightly for someone else. Some of it is based on your history, but some of it is just data collecting… like, does it work better to use this ad or that ad? Does it work better in red or green? Does it work better positioned here or there? This data is all being crunched, often in real-time — to deliver to you the most pleasant experience possible. Haha, sorry, not quite — to deliver to you the most profitable experience for someone… is the better answer. Facebook is worth $500 billion, and their revenue stream has to come from somewhere, since 99.999% of the people who use Facebook have never given them a penny… so, rest assured, those who are paying want to make sure they’re getting their maximum bang for the buck.
And, of course, an awful lot of data is being collected about this virus, and there are disagreements about what’s important. As per above, it’s always a good idea to gather it all and then figure out later what matters and what doesn’t. Sophisticated modelling techniques do this all the time. For example, a neural network. That sounds a lot fancier or scarier than it really is. It’s not some sort of artificial brain which can think for itself, become sentient and launch an attack on humanity… rather, it’s just software for taking a ton of data, much of it possibly unrelated, and grinding through it in such a way that it “learns” what inputs are relevant to outcomes, and which are noise. A properly trained neural network can be very useful for predicting outcomes that a person may not as easily see, because it’ll have filtered out the irrelevant aspects and focused only on what makes a difference.
A simple example would be trying to train a neural network to predict the outcome of horse races. This is a project that as been on my “to-do” list for about 30 years, and perhaps if enough horse racing returns soon, and I’m still locked up at home, I’ll finally have a chance to work on it. And I will tell you exactly what I plan to do, and what I hope to find. The first thing is to take tens of thousands of historical races and format the data in a way that it can be fed into a neural net. Then, it will grind away on it, “learning”… and I would assume it’ll find a high correlation for specific horses with respect to things like fractional quarter-mile times, weight carried, relative class of opponents and track-surface-conditions. It’ll find a low correlation with things like the name of the horse, what time the race was run and what day of the week it was. That’s the beauty of the neural network; just throw all of the data at it, and let it figure out what matters. It might figure out correlations for specific horses… that even the most astute handicapper or sharpest bookie might miss.
I know a lot of people reading this are thinking whoa dude, that’s pretty cool. Yes, it is… it would be. I’ll keep you posted.
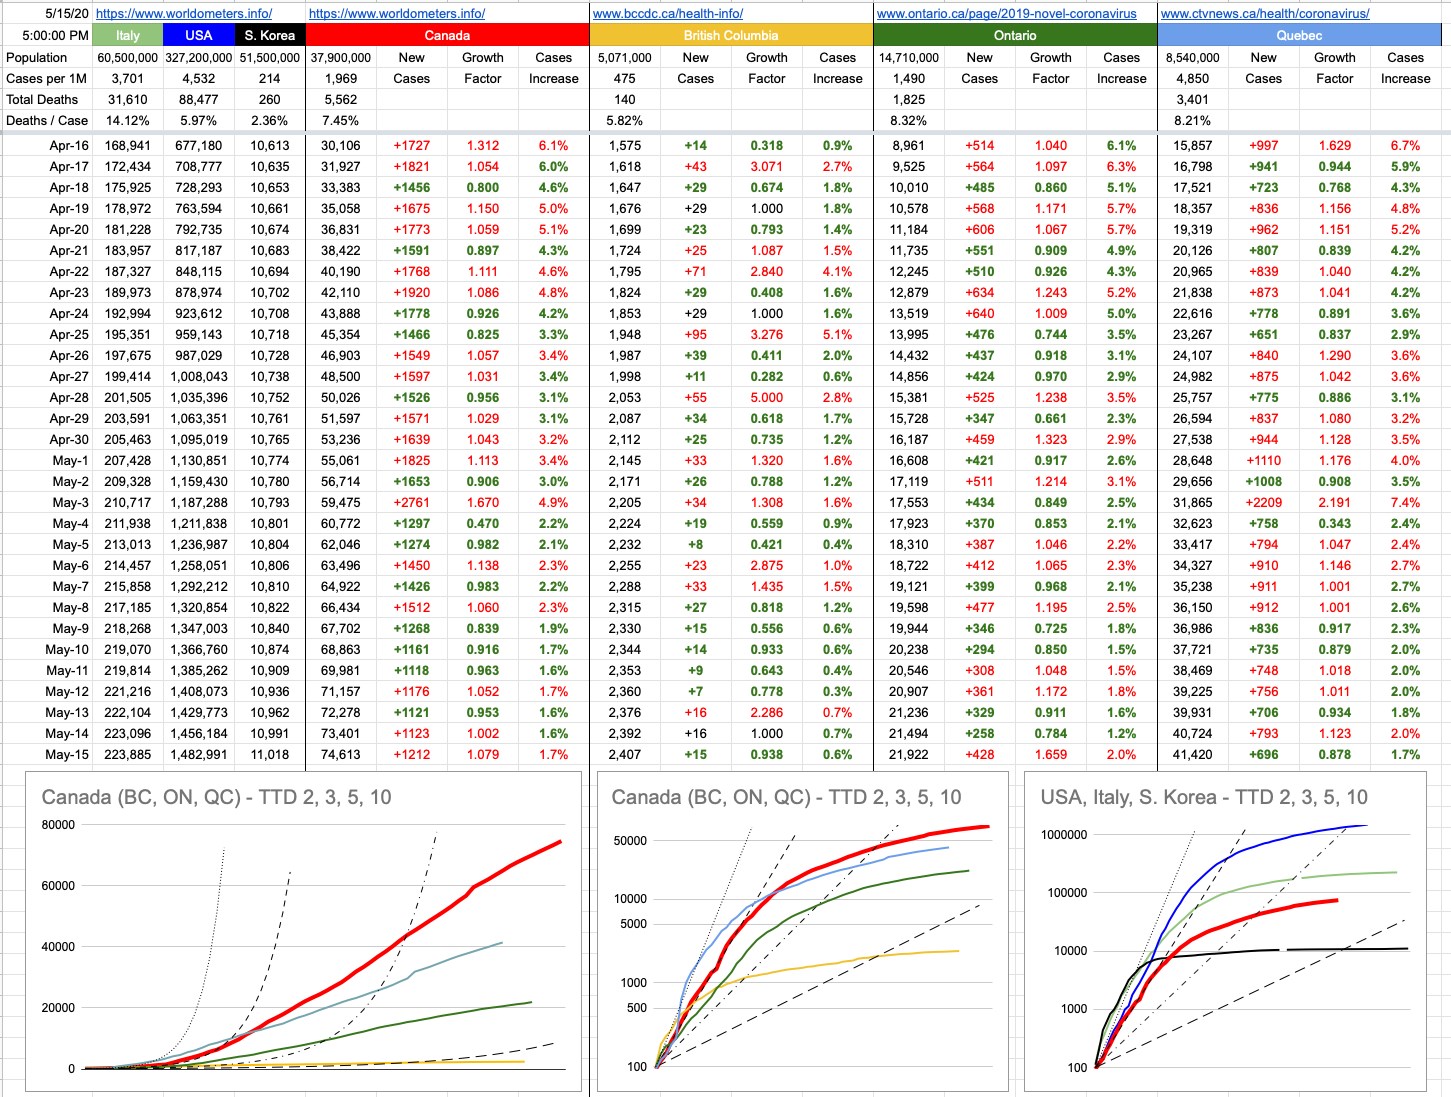
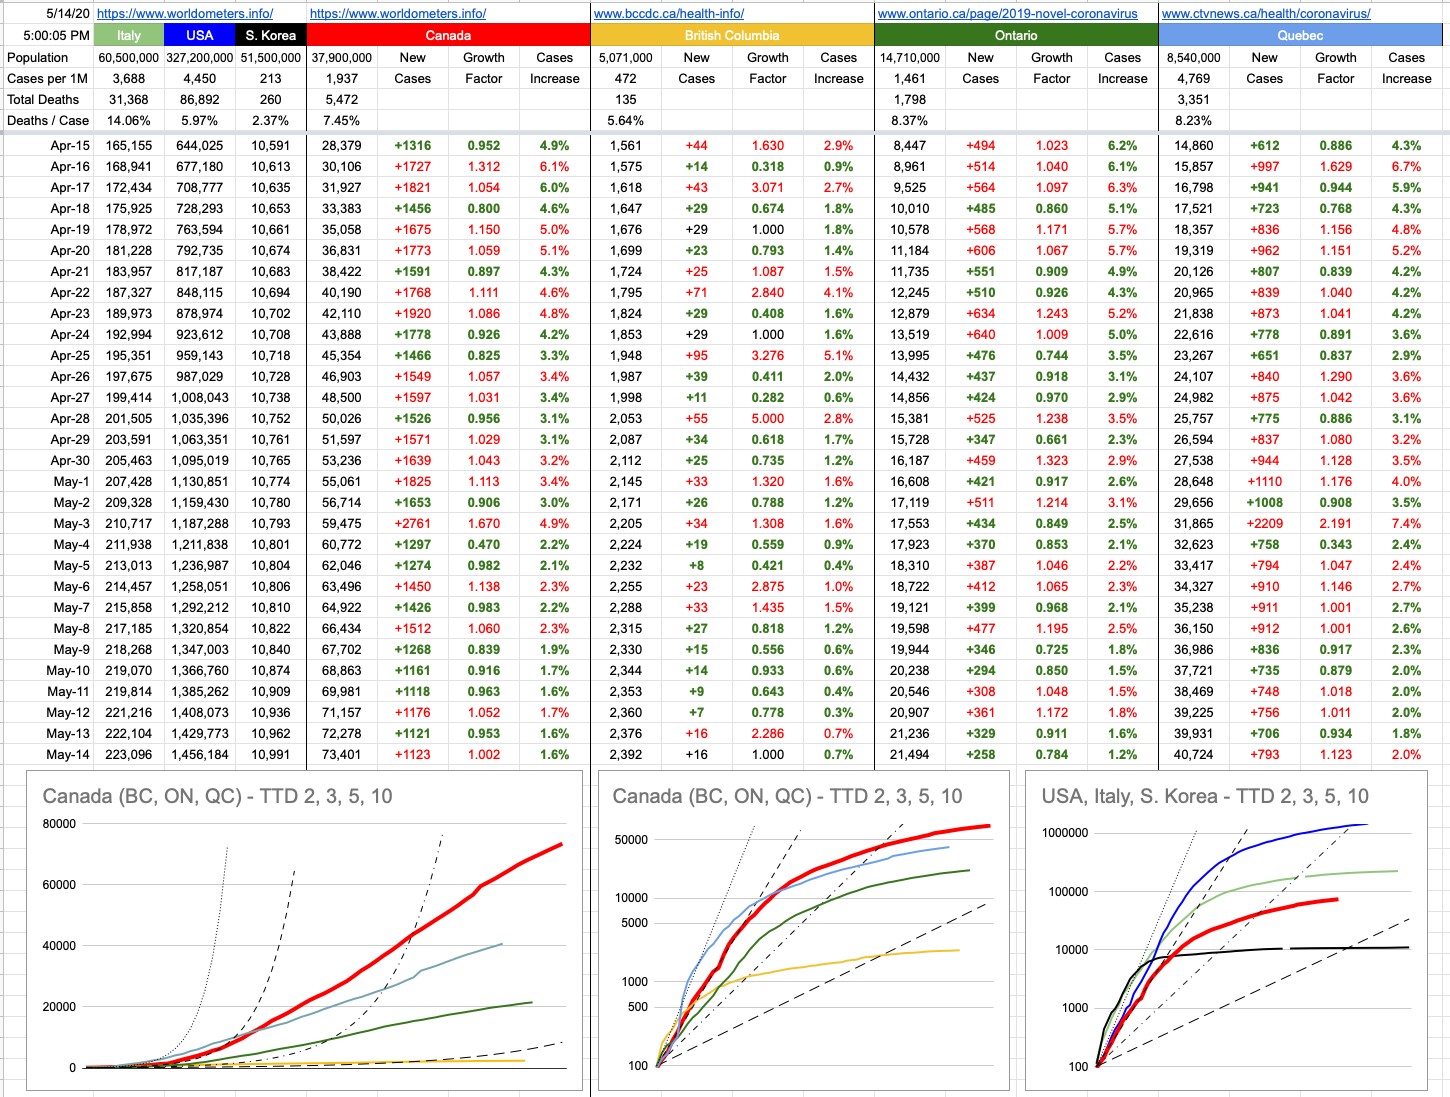
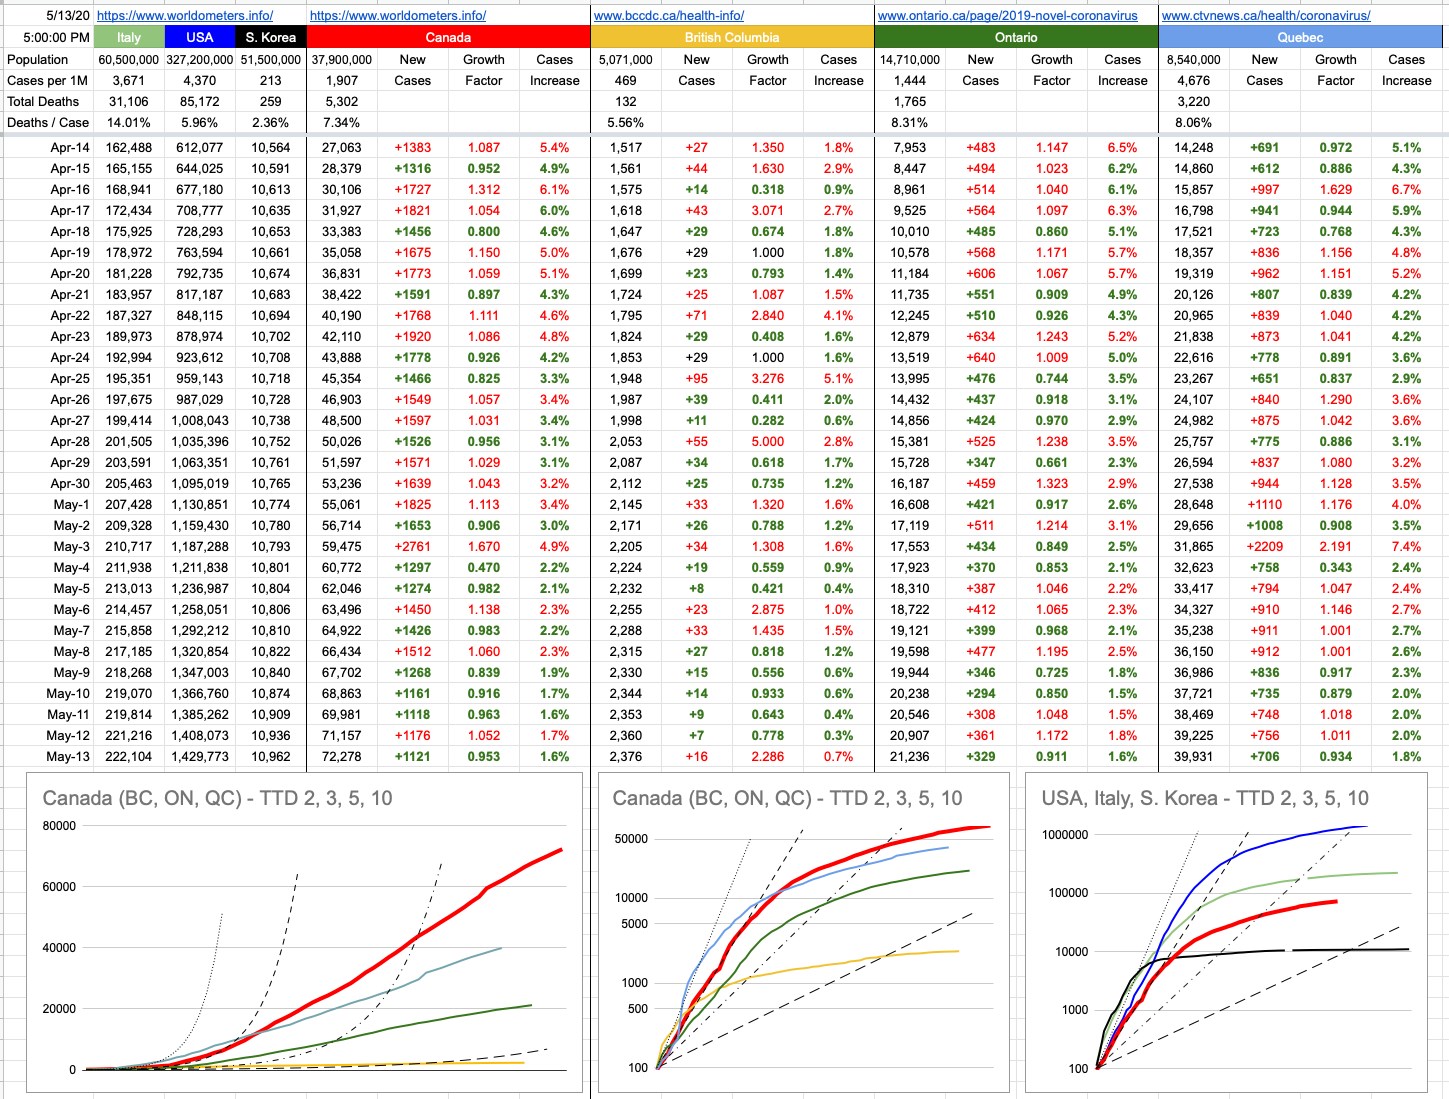
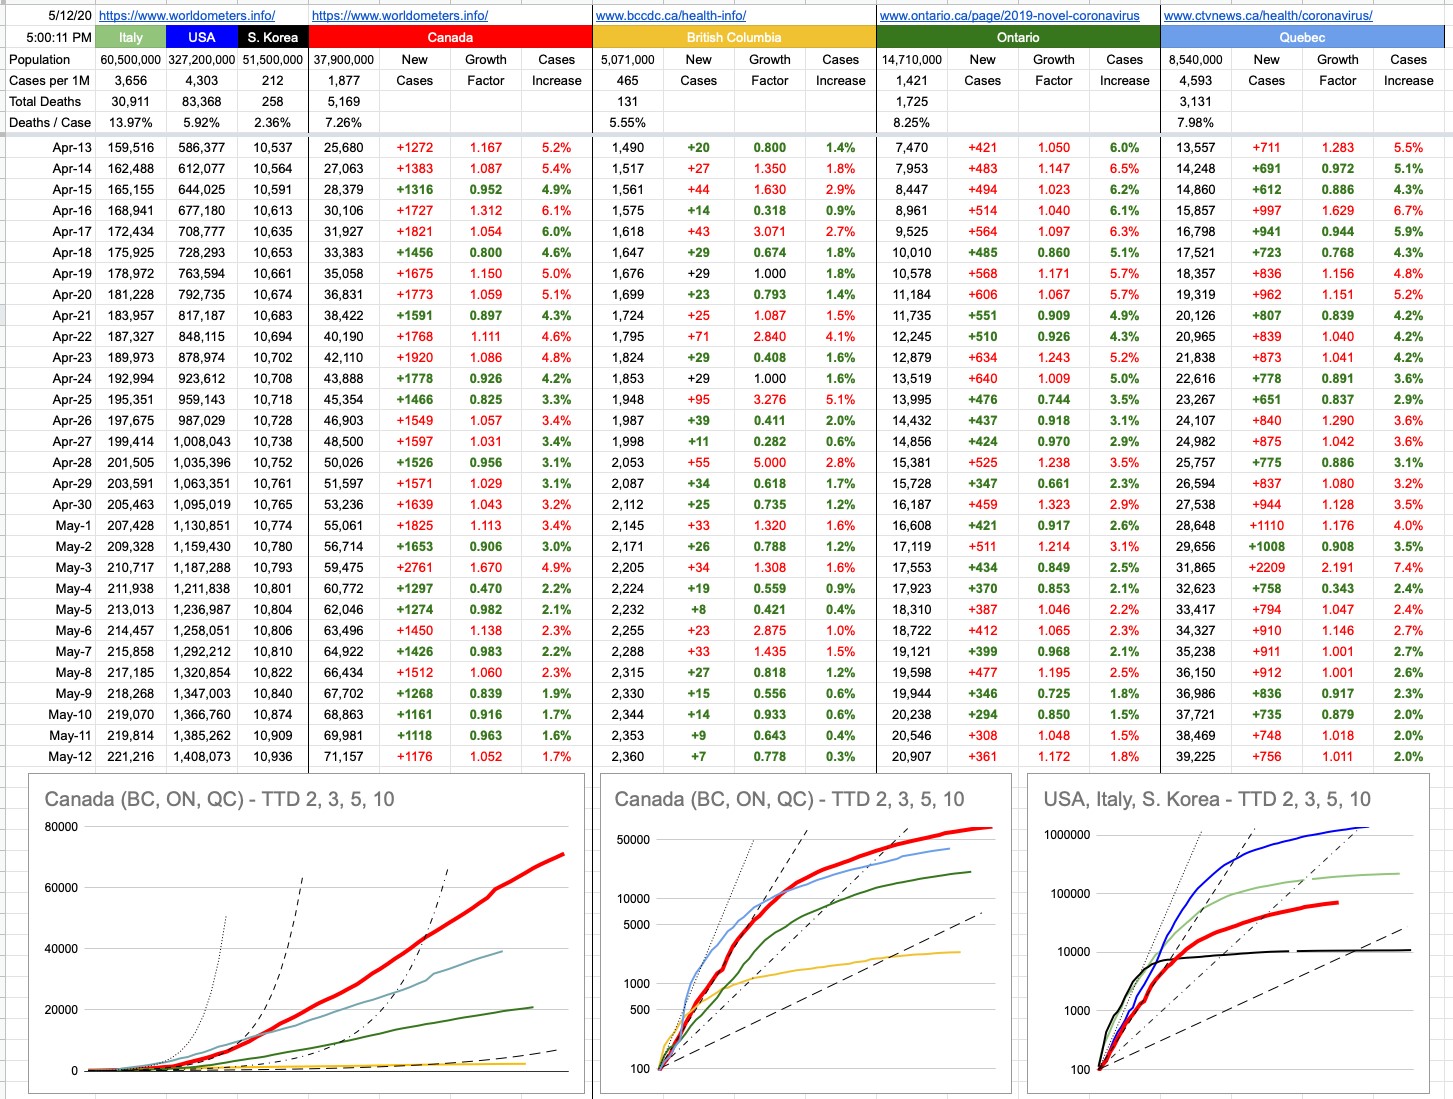
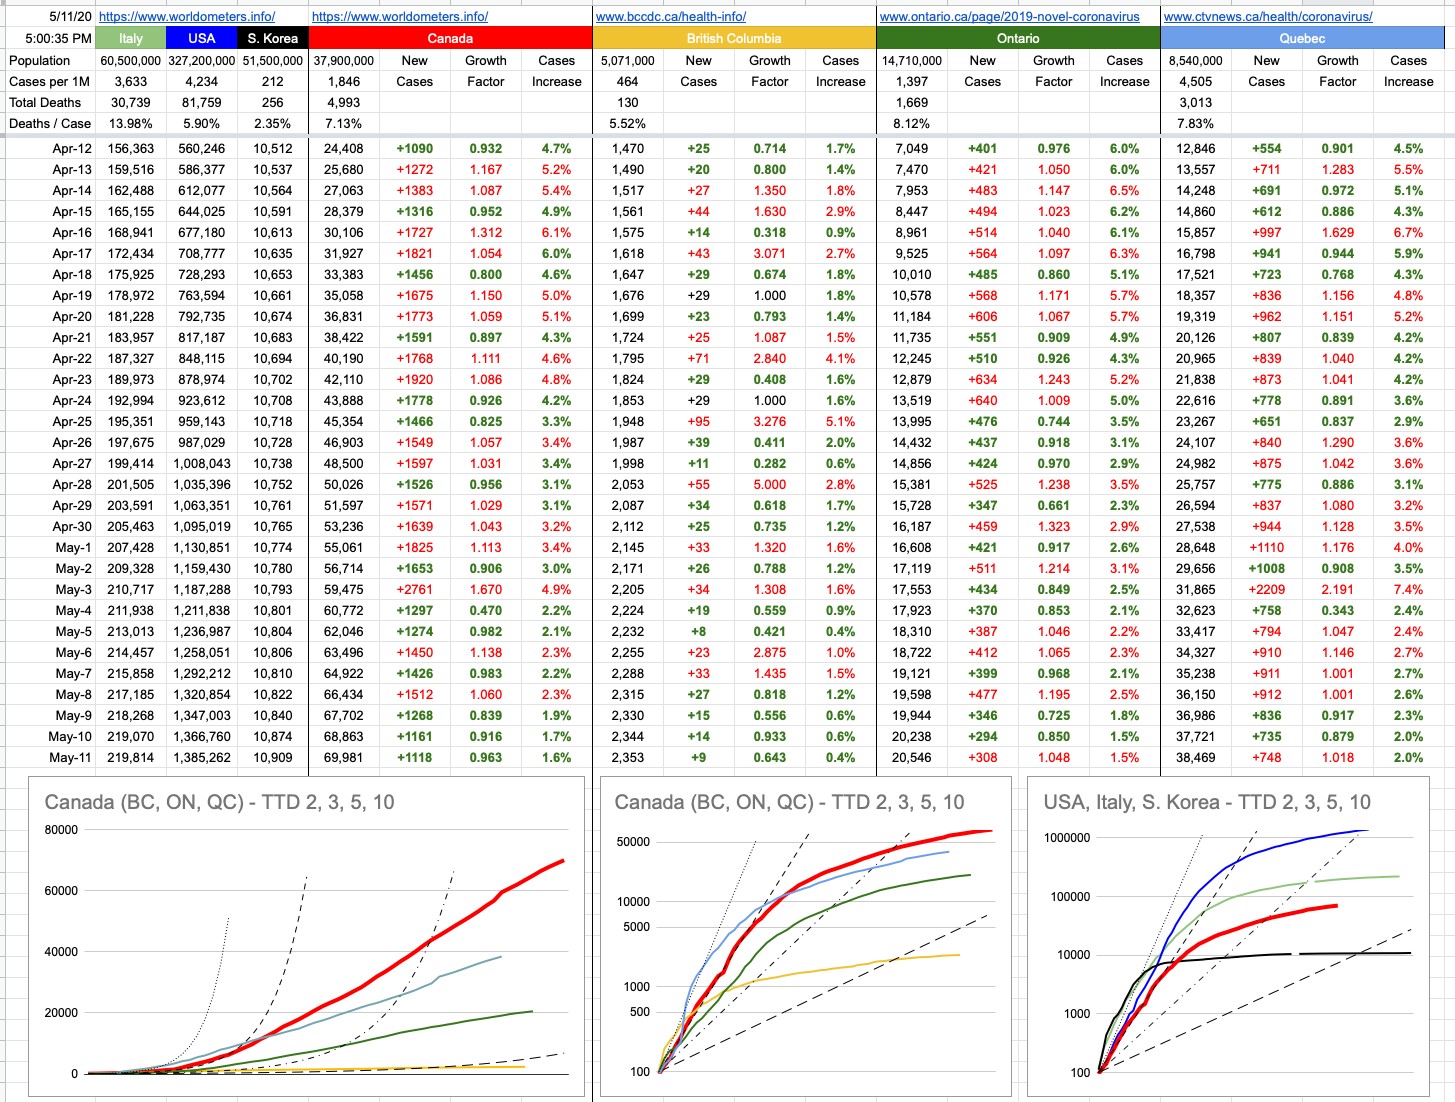
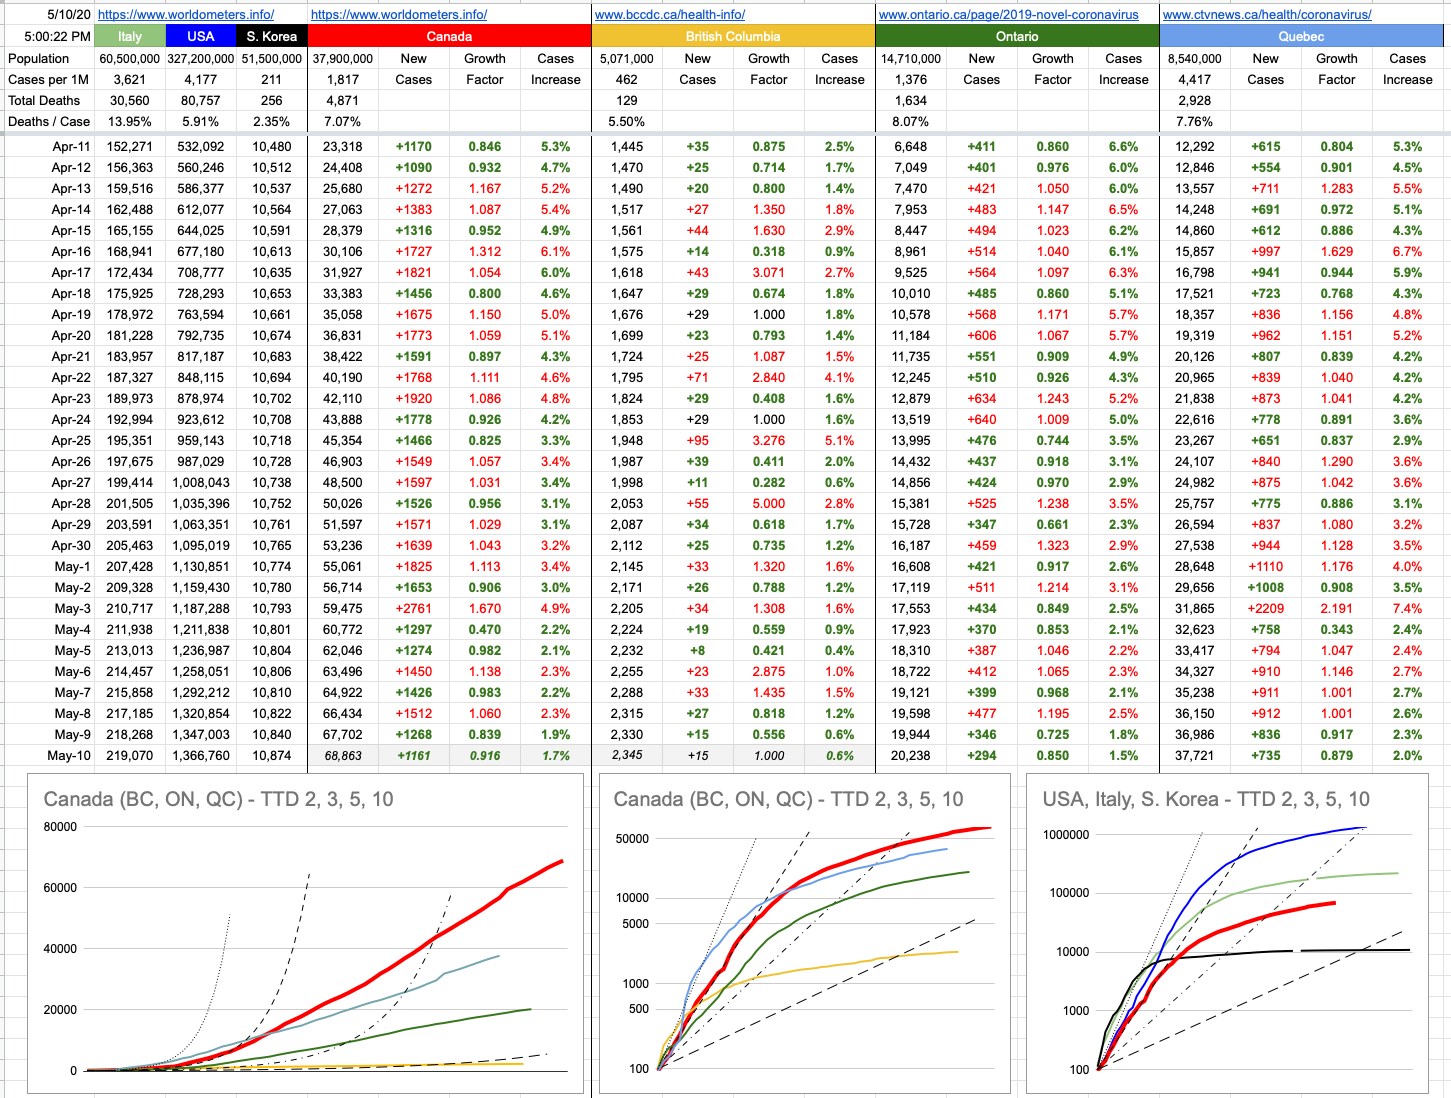
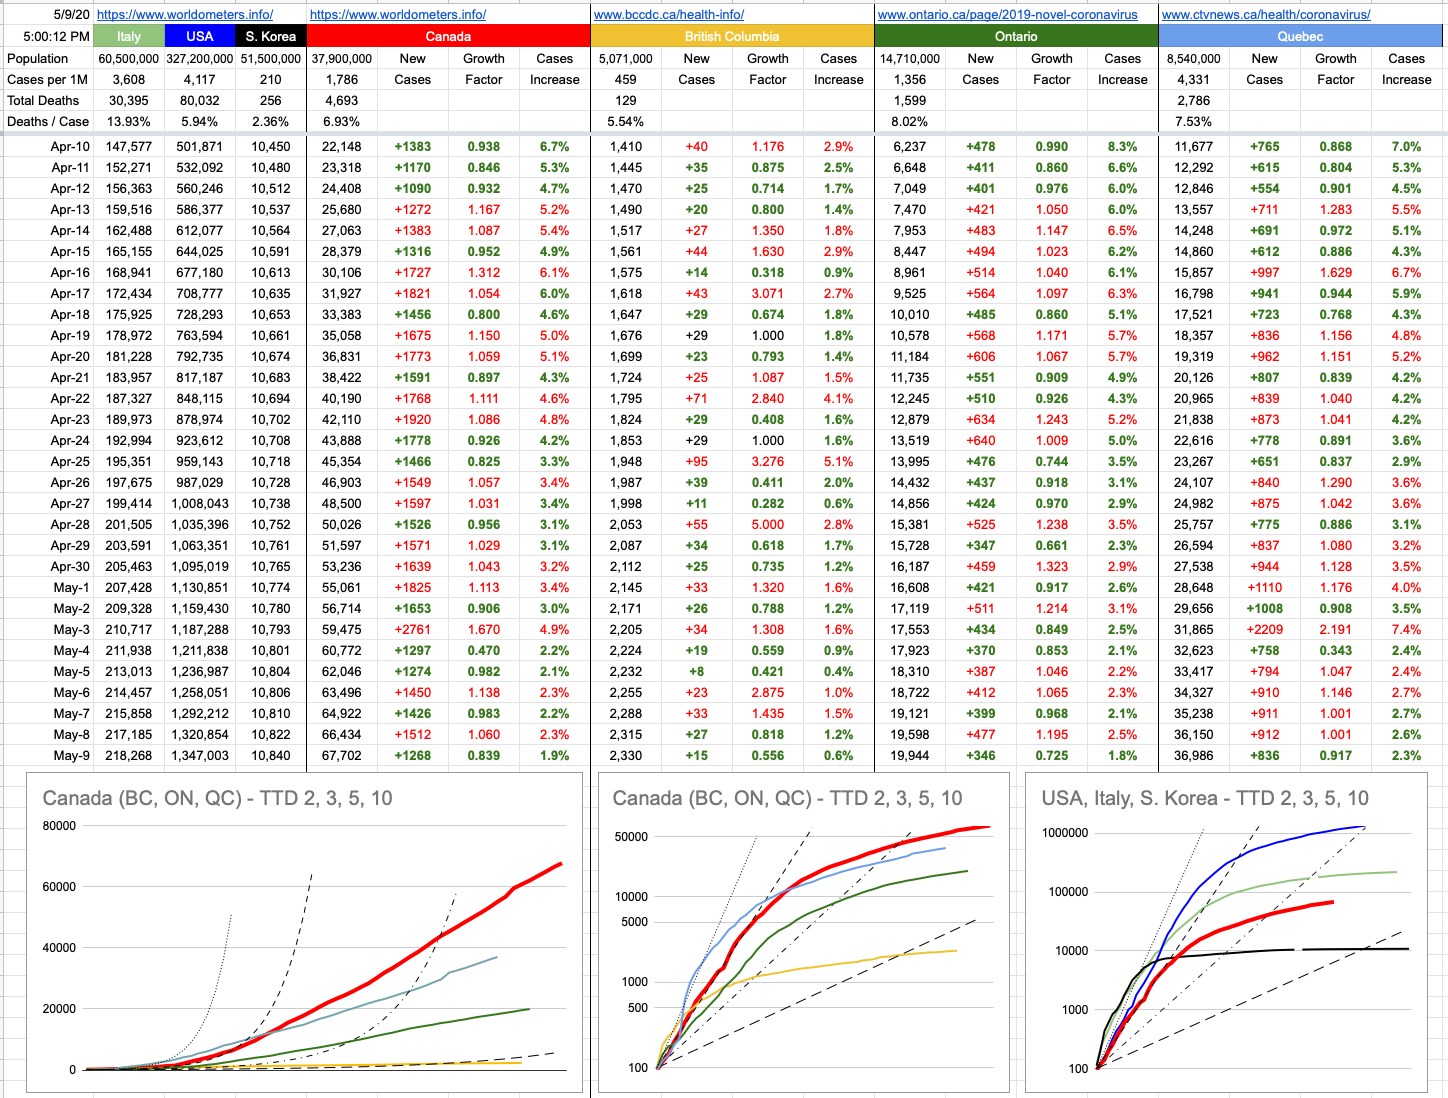
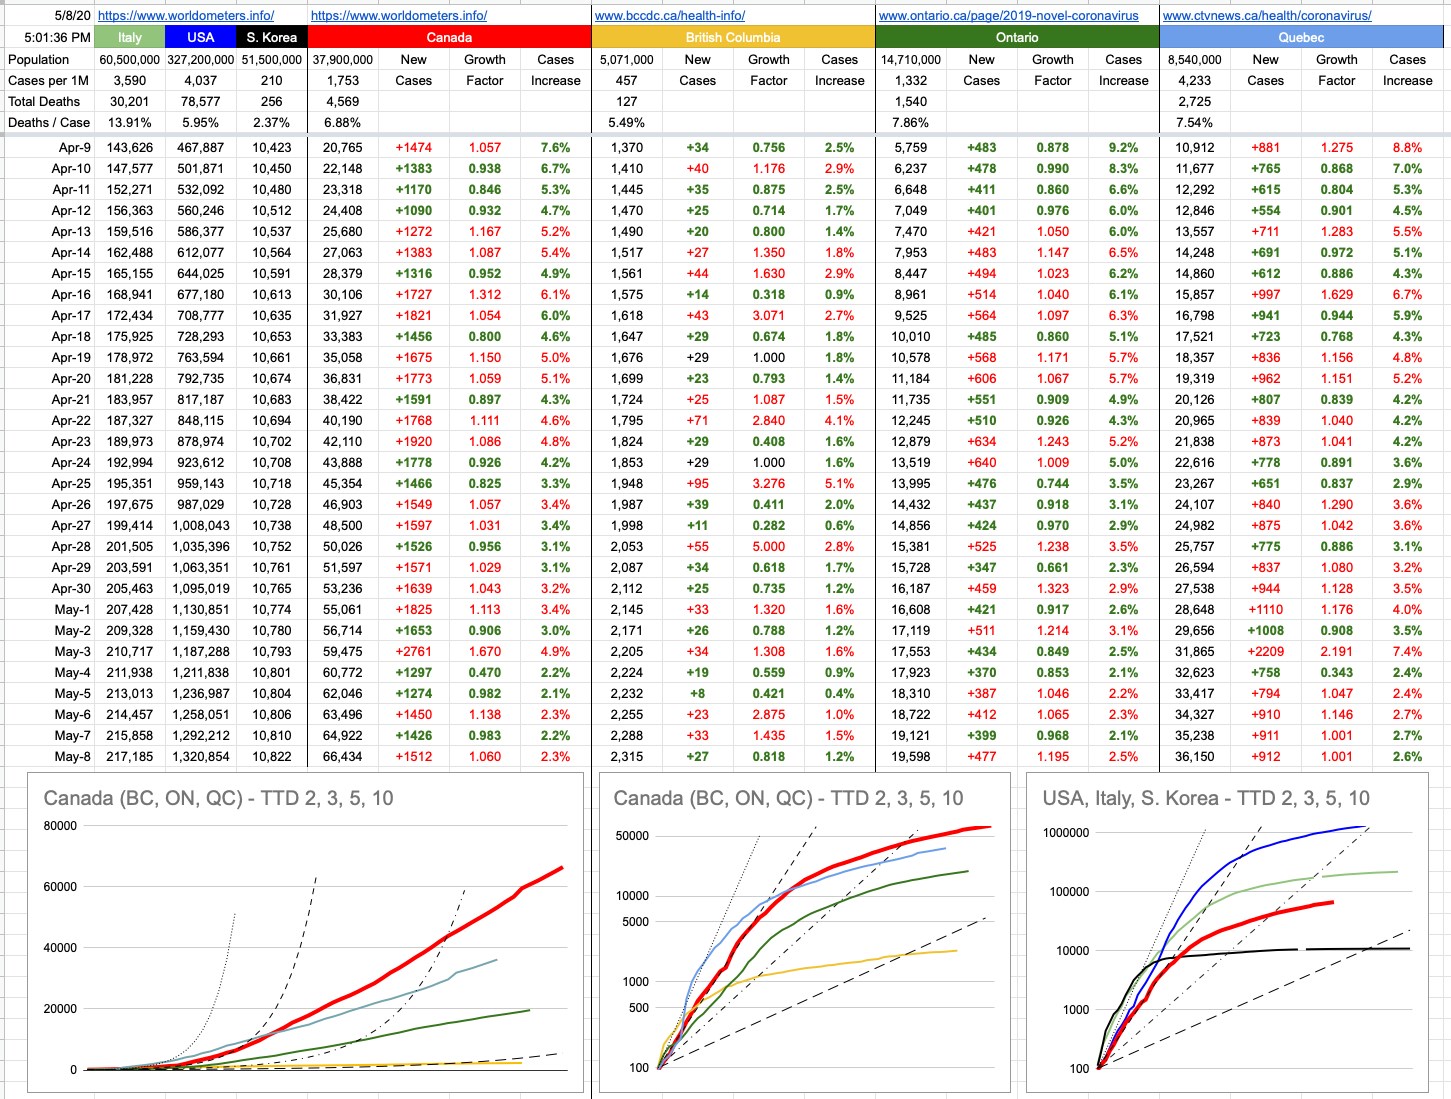
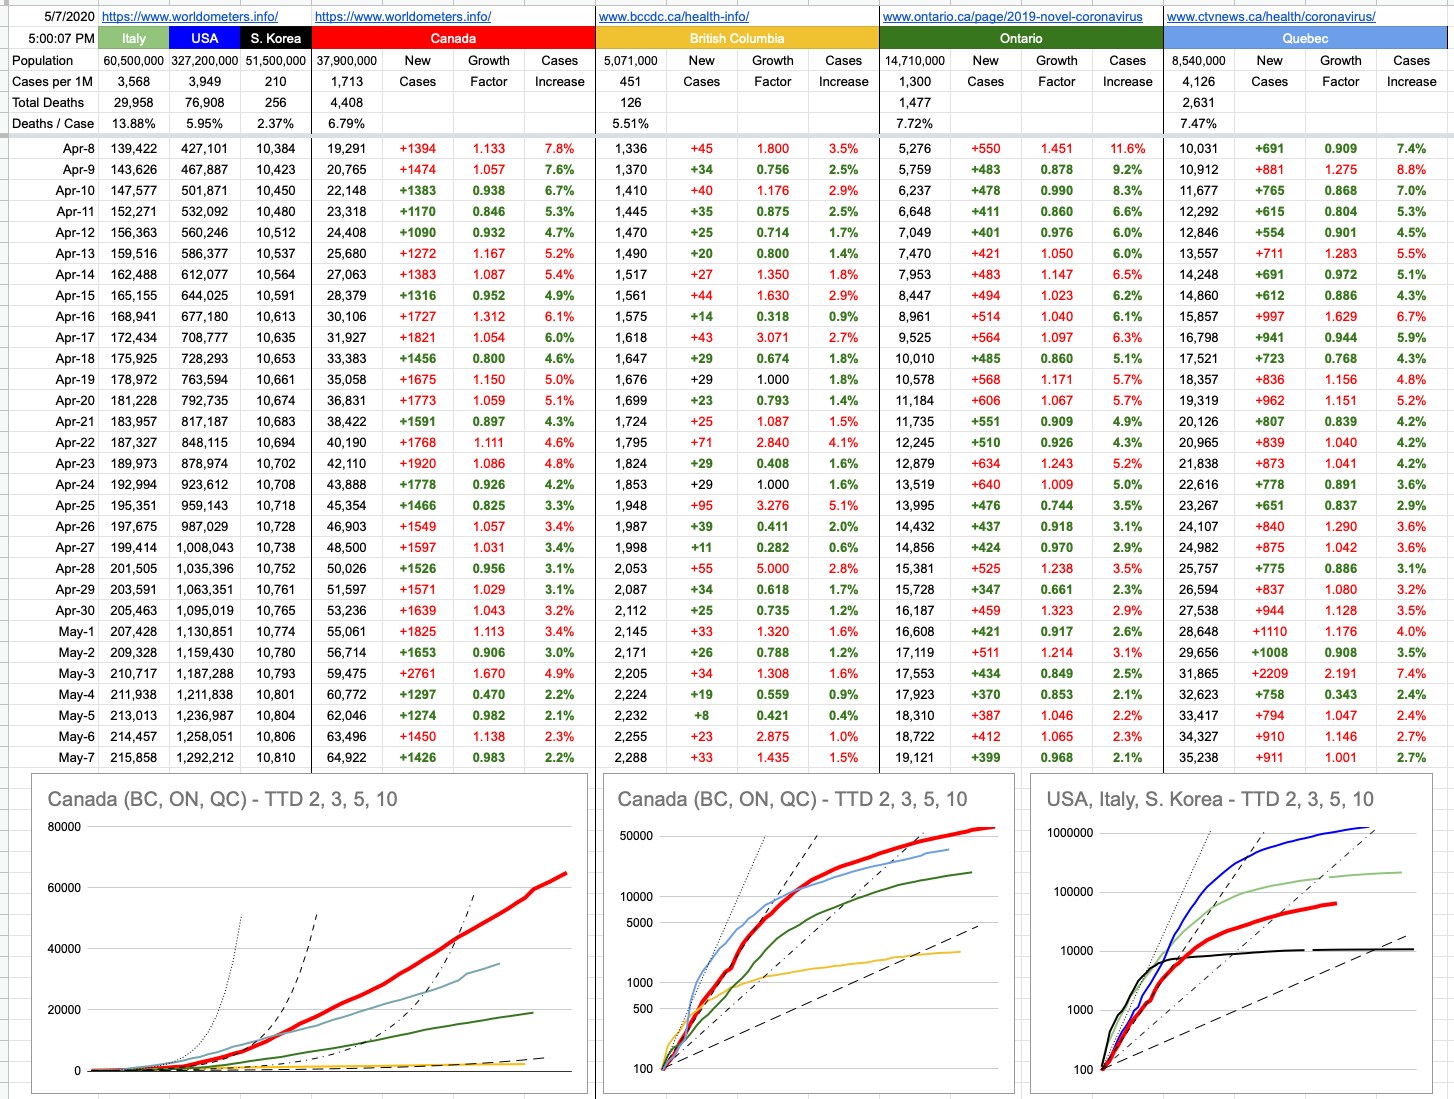
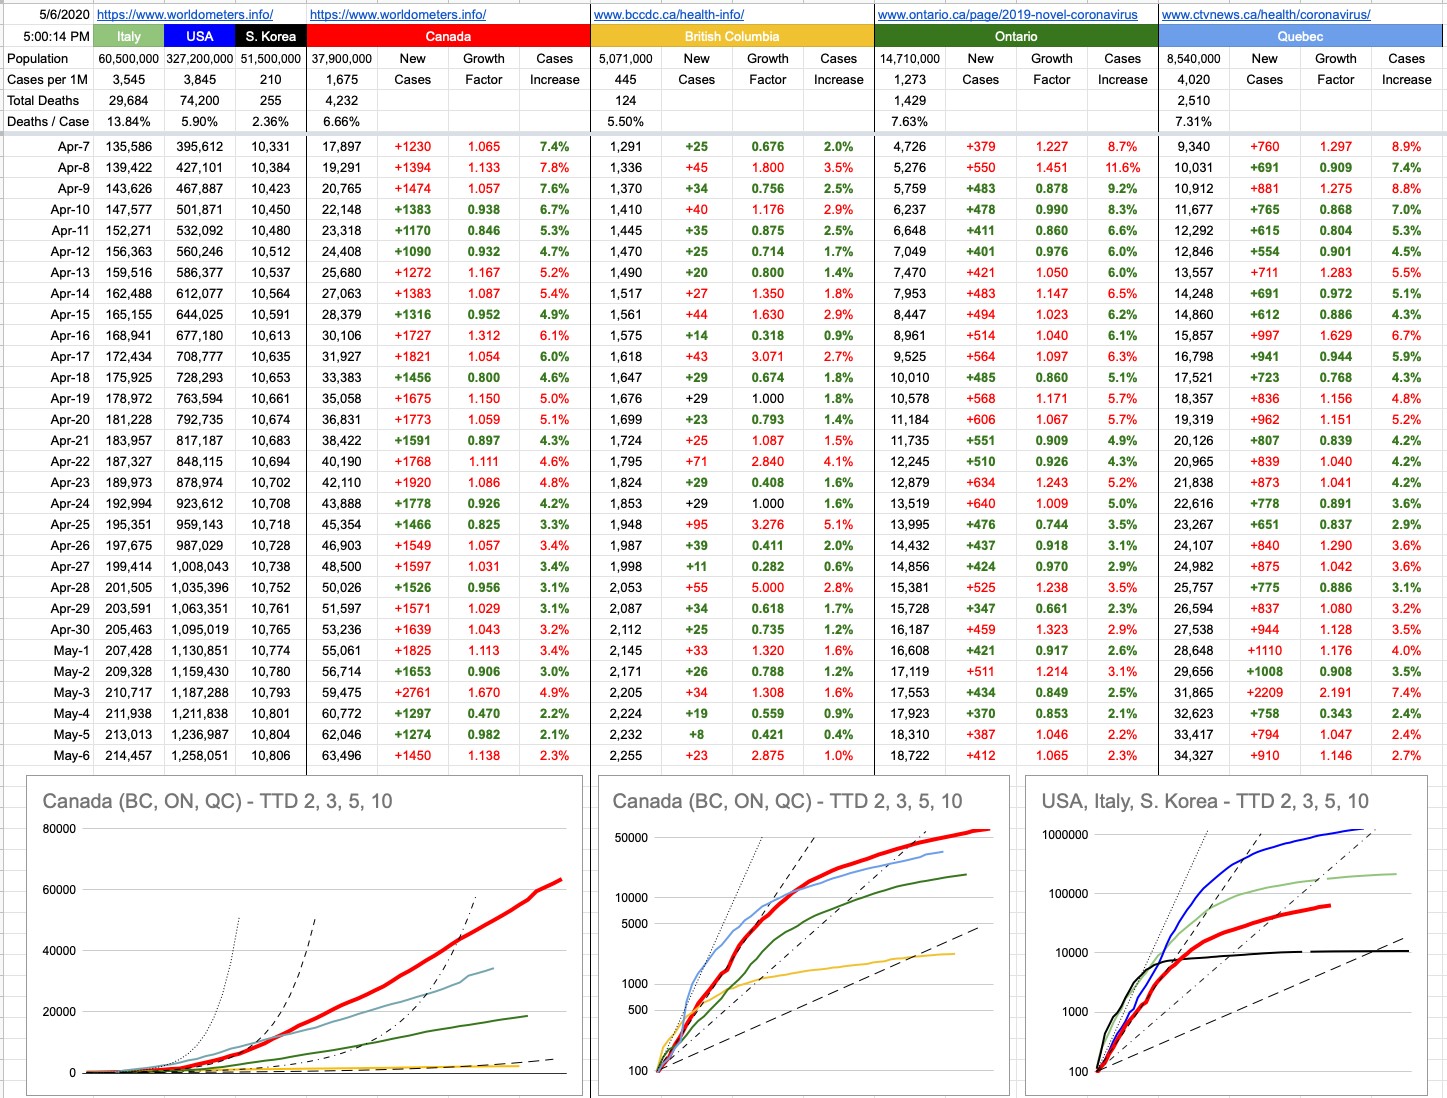
More relevant to all of us are our local numbers, and there are many to look at. We are on track (haha!!) for opening things up soon, and, at least around here, it makes sense. It’s been a while since I’ve talked about “Time To Double”, so let’s look at that a bit. The graphs below don’t do justice entirely to where we’re at, because TTDs when presented in this fashion becomes a “lagging” indicator. Things are better than what those graphs imply, if you’re looking at the TTD lines.
Recall, back in the day… like back in March, which seems like it was 20 years ago… we were looking at some scary TTD numbers. The new-cases numbers were increasing by about 25% day-over-day, a TTD of about 3. Scary exponential growth.
If we take some averages of the last 5 days of confirmed new cases… the TTDs and percentages look like this:
B.C.: 130 (0.53%)
Ontario: 43 (1.63%)
Quebec: 37 (1.89%)
Canada: 44 (1.62%)
These are obviously very-flattened curves, compared to where we were.
I am well aware of the people standing up screaming that those numbers aren’t real. Have a seat, and let’s discuss the obvious. Of course not. There are more, and have been more, cases than we’ve “known” about. We will in due course know how “off” we were… like is the real number 10x that? 100x? 1,000x? I’d love it, if it were 2,000x because that’d mean we’ve all been exposed to this, and if you believe that gives you immunity (and that seems to be the case with coronaviruses in general), we’d be in great shape. That number is way too big, but while I’m here, in an effort to make numbers and guesses and projections more accurate for all of us, I urge you all to visit the bccdc dot ca site and take the survey. You may even get a serological antibody test out of it.
Inaccuracy of those particular numbers aside, there are some concrete ones which are indisputable… hospitalizations, ICU cases, “pressure on the medical infrastructure” and excess deaths… to name a few of the most critical ones. These numbers vary wildly around the world, but they’re the best indicators, along with new cases, to indicate how close jurisdictions are to phasing-in re-openings. At least around here, those numbers look good… good enough that we’re marching ahead to the next phase.
View Original Post and All Comments on Facebook


