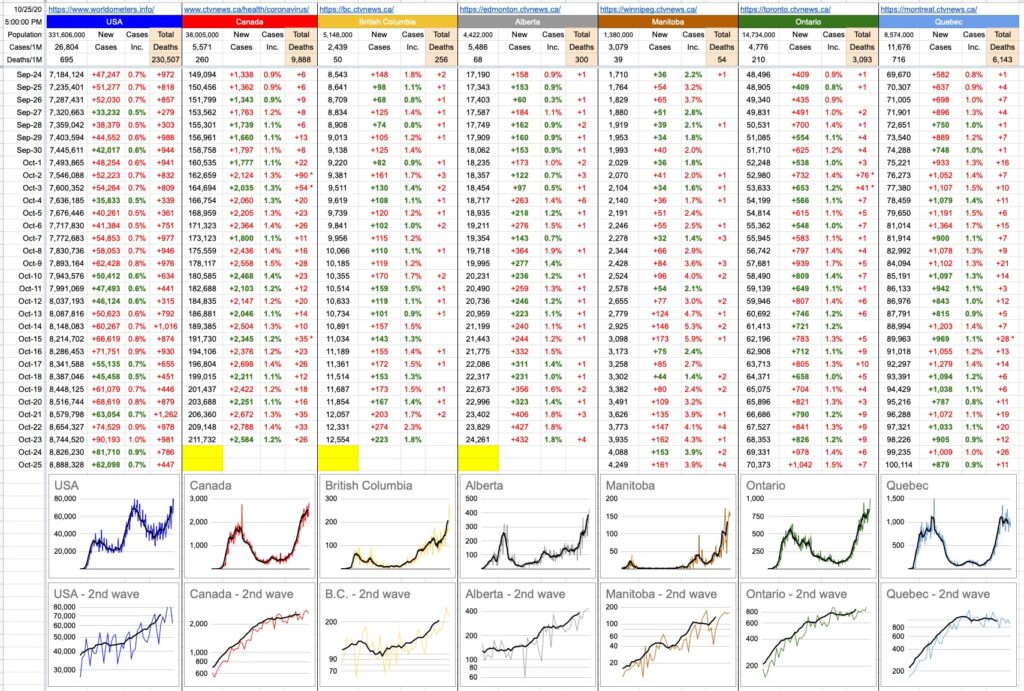
Like the NDP in B.C., COVID-19 is back for a 2nd term… and it’s more powerful than the first.
I’ve added a new series of graphs… these are a subset of the graphs above them, and plotted logarithmically… starting at a good guess with respect to the beginning of Canada’s 2nd wave – right after Labour Day.
Since they’re logarithmic, they tend to squash the numbers… but that’s useful, because it tells you at a glance when the growth has stopped… like when the new-case numbers are linear, not exponential. Indeed, if you look at Quebec, the bad news is that they’re getting 1,000 new cases a day. The good news is that those numbers have been steady for a couple of weeks. Don’t get me wrong, 1,000 cases a day isn’t great, but it’s far, far better than the implication of seeing those numbers continuing to rise sharply.
Which brings us to everyone else… where, across the board, every other province is edging upwards. That part is expected. How steep and how long… that remains to be seen. We’ll see what B.C. and Alberta – and therefore, the national picture — looks like tomorrow.


The HK Daily Report (0.53 min read)
People (everywhere, it seems) are noticeably losing interest in further Covid measures like a sprint horse in the stretch trying to run a distance (I could have said “like a Canadian hockey team deep in the playoffs” ????). Let’s see what happens once the US election is over and much of the political motivation disappears (regardless of results). Will also be interesting to see if there is any change in the BC NDP’s approach after yesterday’s win.