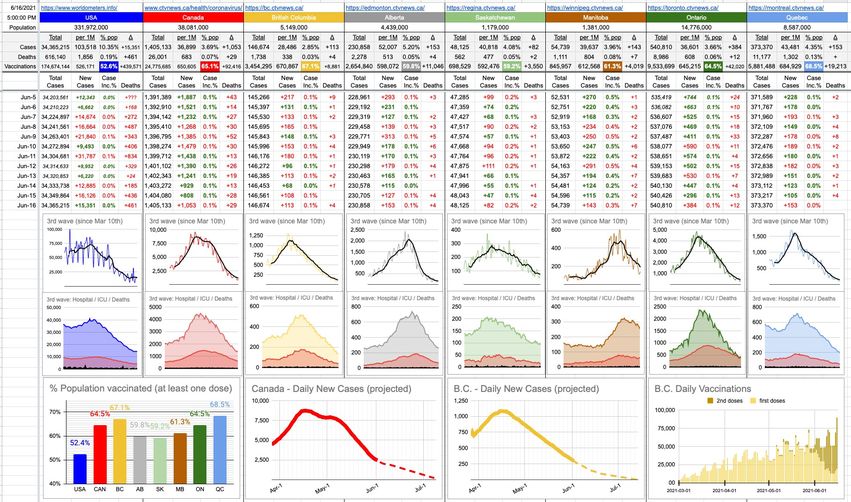
If you’ve come to the conclusion that I like to play with numbers and present them in interesting ways, you’re right… because sometimes, a picture is worth not necessarily 1,000 words, but maybe 1,000x the understanding.
I wrote a while back what I would consider a logical strategy for gearing up second doses. At some point, for numerous reasons, after going nuts with first doses, we need to turn a corner and start giving out lots of seconds. When and how many? I provided my optimized formula that gets us hitting numerous finish lines on exactly July 1st… and, in my version, it meant really firing up the second doses starting last week… at the expense of first doses.
I’m not saying the province is listening to me, but it’s at least nice to feel a bit validated that whatever I came up with isn’t complete nonsense, and that someone in some provincial health office came up with something very similar.
Accordingly, check out the cool new graph on the bottom right; there’s a very visual breakdown of first/second doses… with firsts being the lighter colour and seconds being the darker colour… stacked up, on top of each other; the sum of the column is the total doses administered that day.
Even though vaccinations began trickling in back in December, this graph only goes back to March, up to which point is was all first doses, just in smaller numbers. In fact, it wasn’t till late April that we even began with anything more than a handful of second doses. You can see the dark spots barely a pixel big appearing on the top of those columns.
But… recently… a major shift. These days, the majority of jabs are second doses. The vast majority.
Notwithstanding the gaps of weekend data (which I’ve extrapolated to smooth out gaps), the B.C. trend is still upwards. The provincial government has stated the infrastructure is in place to deliver as many shots as we get, and for now, I’m not doubting it. Today saw 62,237 jabs… that’s 12 out of 100 British Columbians getting a dose, and 95.4% of available doses have been administered.
All of this bodes very well for the near future… the sum of even more vaccine shipments coupled with demand that is still going strong.
When you combine it all together, all things considered, it paints a very pretty picture indeed. Far more than a thousand words’ worth.


The new BC Daily Vaccination graph is awesome – great way to understand how vaccination is progressing!
Switching to second doses is pretty much unavoidable… the first doses have pretty much hit their practical max.
Concurr, my number crunching analyst Analyst wife figures that we only have 8% of the population to do first innoculations on before we are left with underage medically contraindicated and refuseniks. Time to concentrate on the 2nd jabs. The over 65 crowd will be done early next week and then rhey will continue rolling out 2nd jabs as you describe. Hopefully getting to max immunity prior to var. Delta arriving in significant numbers. Potentially a horse race but they are getting there.