Day 7 – March 23, 2020
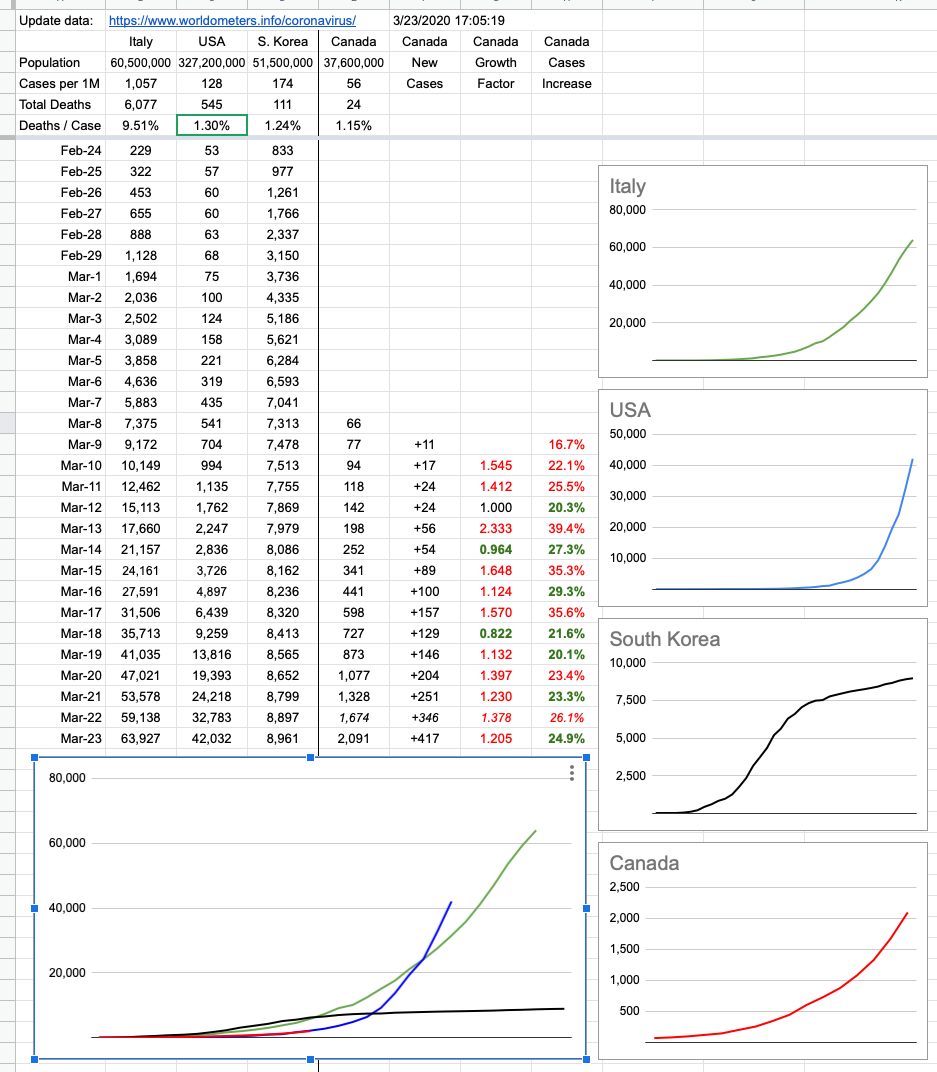
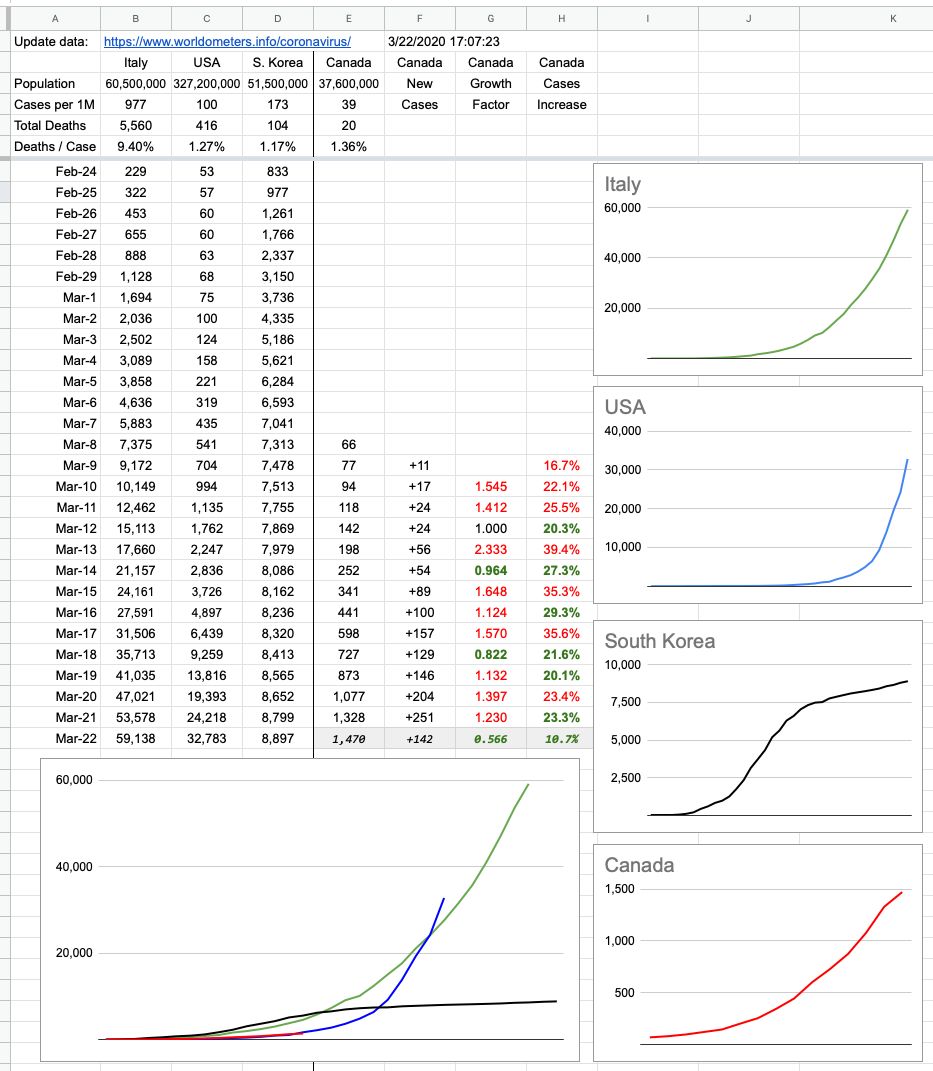
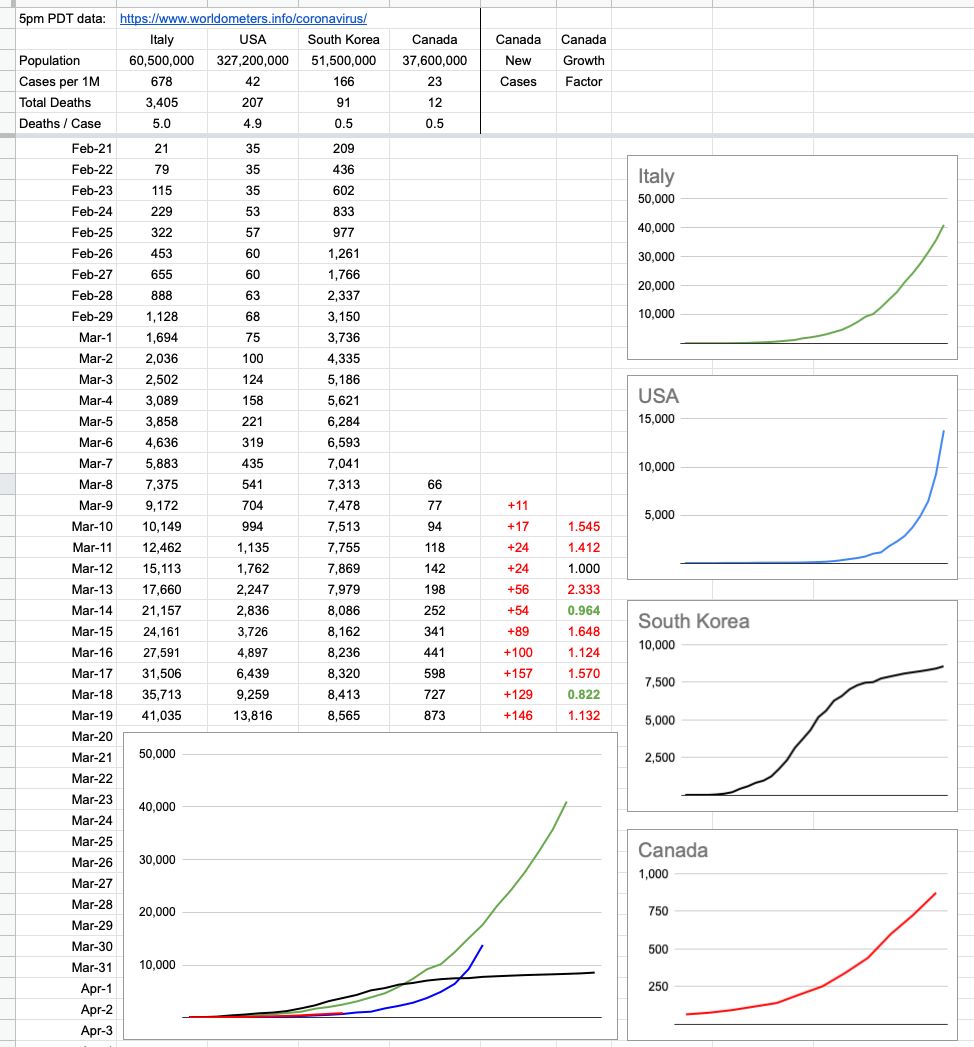
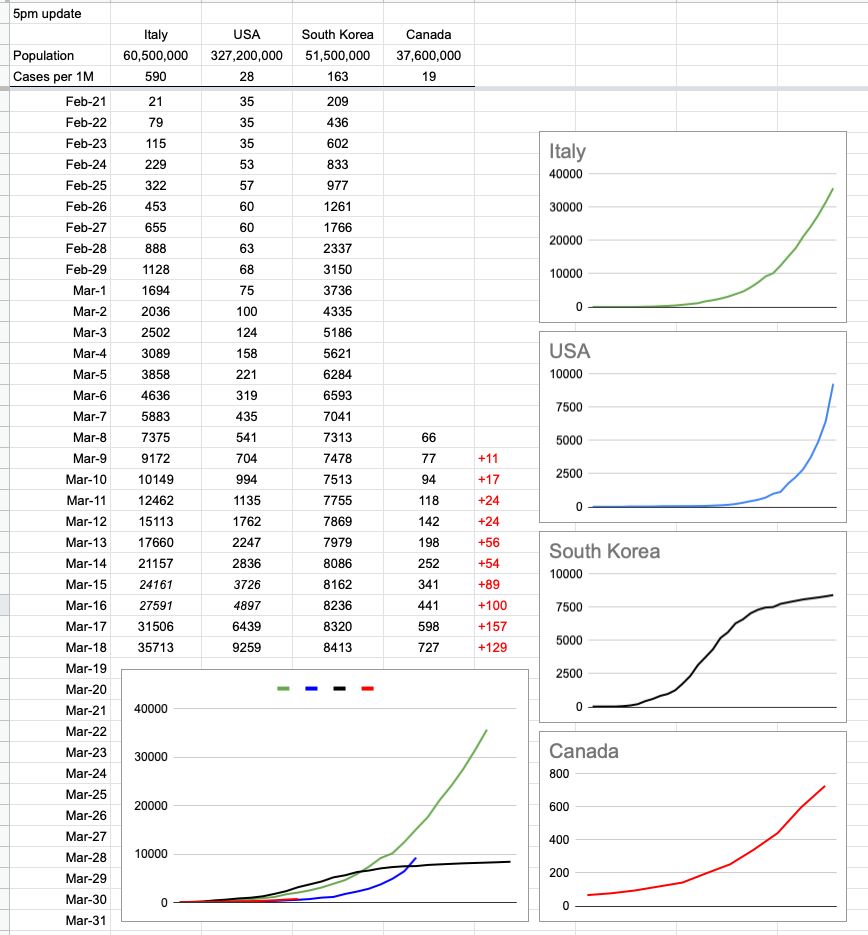
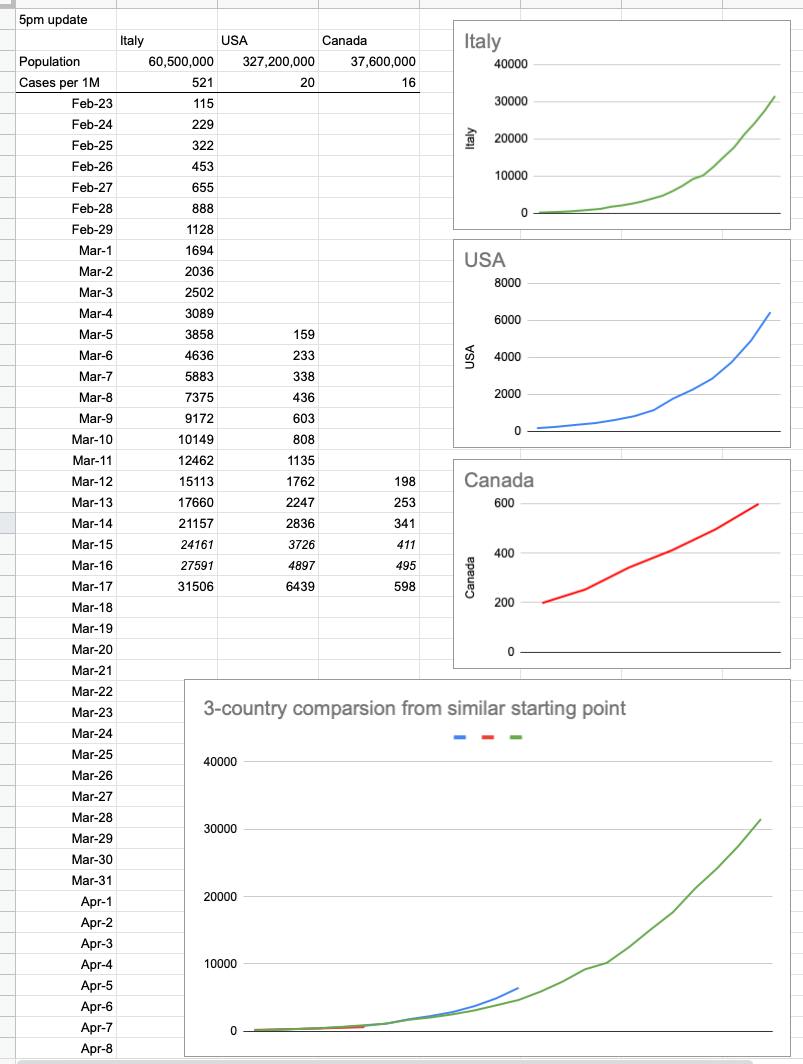
The lack of data over the weekend left a bit of a gap… which I filled in with some guesswork. I know where we were on Saturday, and I know where we are now. How we got here looks to be pretty consistent, but the next few days are more important than the last few. We are tracking very closely to the US, trailing by 10 days… just before things started getting really out of hand down there.
It’s important to note that I’m tracking new cases — not active cases. It was good news to hear that 100 cases in BC considered active have been resolved to “cured”. More than 300 in Canada overall.
As time goes on, we can look forward to that number of resolved cases growing, but note that its growth doesn’t affect tracking new cases. Those will always go up. In fact, at some point, it’s (hopefully) likely we will have “negative” days — where there are less new cases than resolved cases… but the idea of these graphs is to simply track the spread (and control) of new cases. What we do with them is a whole other question, and I’ll be happy to offer my opinion on that as time goes on. So far, comparing it to what’s going on elsewhere in the world, it’s pretty good. And will gradually look a lot better if you all just #stayhome!!
View Original Post and All Comments on Facebook


