BritishColumbia

June 6, 2021

Happy Sunday!

You might think there’s nothing good about B.C. being the only province that doesn’t update C19 numbers over the weekend… but you’re wrong!

… because it means… contest time!

I’m not sure how long I can keep doing this, because at some point the numbers get too low… but that’s a good thing. I hope the “It’s not worth running a contest” thing happens sooner than later… but, until it does, we’re doing it again: Take a guess at what the cumulative (Sat/Sun/Mon) new daily cases will be – put your guess in the comments below – and whoever is closest will get (besides *coveted* bragging rights) $100 donated to their charity of choice.

To help you with your integral calculus, statistical analysis, regression… or just good old-fashioned, plain, intuitive guessing… here’s what the last several weekend totals have looked like… and please note the very-encouraging and consistent dwindling towards zero:

Apr 24,25,26: 2,729
May 1,2,3: 2,174
May 8,9,10: 1,759
May 15,16,17: 1,360
May 22,23,24: 974
May 29,30,31: 708

Guesses will be accepted till noon tomorrow. Henry, Dix, Horgan & their associates are banned… but anyone else can play!

Numbers will be released tomorrow at 3pm… and I’ll post the winner at 5pm.

Good luck!

June 5, 2021

There are lots of discussions going on with respect to what exactly happened to the flu this year. It was certainly expected that the social distancing and masking would have an effect, and that numbers would be lower… but nobody really expected it to be virtually zero. The number of pediatric flu deaths in the U.S. this season was exactly one (where it’s normally in the hundreds), and you can be sure that unfortunate kid caught it from a foreign traveller.

How do I know that? Because the flu, like C19, is a virus… and viruses need a breeding population of hosts that they can infect.

Unfortunate side-note for those of you who want to believe in Bigfoot or the Yeti or the Loch Ness Monster or the Ogopogo; perhaps the biggest show-stopper in there being a possibility of them existing is that you can’t have just one. You’d need a breeding population, and it’d have to be significant enough to perpetuate the species. They’d take up a lot of space, and there would be ample evidence (droppings, dwellings) to find, even if not the creatures themselves, whether on land or in the water. It’s not like “I saw *the* Ogopogo”; Lake Okanogan would have to have been teeming with them for centuries.

The masking, and sanitizing surfaces every 10 minutes, had a drastic effect. Flu probably arrived in North America on various airplanes, but died out with nowhere to go. No breeding population of hosts. In fact, so drastic was its demise that there are two common flu strains that may well be extinct. Around the world, there were zero cases reported of two particularly common strains; two that are always part of the annual flu-vaccine concoction. That, on its own, doesn’t yet mean they’re gone forever… but if they don’t show up next year or the year after that… well, it’s a virus. Unlike 200 BigFoots (Bigfeet?) that might be hiding in a cave somewhere in Sasquatch Park, there’s no hiding place for a virus. When the last one has no place to go, it’s gone forever.

It’s ironic that a couple of flu strains might be eradicated simply as “collateral damage”… while C19, with its variety of variants, is going to be around for a lot longer.

The bigger irony would be that Bigfoot actually exists… but gets wiped out by C19, because the humans were unable to eradicate it.

June 4, 2021

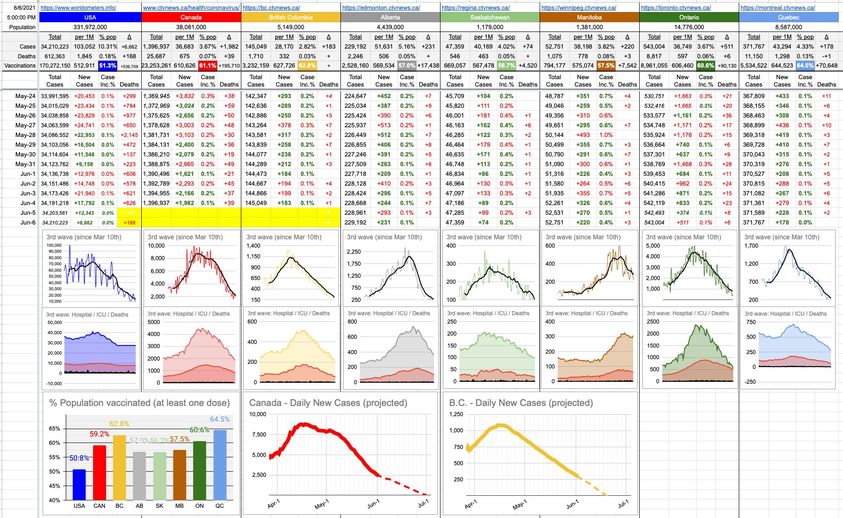
For old time’s sake, I’ve thrown in the graphs showing the progression of this pandemic from day one. If you look below, you’ll see three rows. The first row is the shape of the entire pandemic, going back to Feb 15th of last year. The next row is the second wave onward, starting Sep 8th of last year. You can easily see where that second wave fits into the graph above it. And the third row is the 3rd wave, as of Mar 10th of this year. You can also see where it fits into the one above.

It’s very interesting to note, looking at the column of the 3 B.C. graphs… that our first wave was relatively insignificant in the grand scheme of things; it’s barely a blip in the big picture. That tiny little bump at the bottom left of the top B.C. graph; that’s it. Daily new case counts never broke 100 that entire time… compared to today’s number, +183, which sounds kind of low… and it is. It’s the lowest number since Oct 20th. It’s below what we’re considering the start of the third wave, where, at its worst, we were seeing more than 1,200 new cases a day. The same can be said for hospitalizations and ICU admissions… lowest numbers since November.

Looking at those towering subsequent second and third waves should remind us that, while things are certainly trending in the right direction, it’s not quite over yet. Those flare-ups happened for a number of reasons; reasons which haven’t gone away.

But, of course, one big thing has changed, and it’s not going away… and that is vaccines. And that’s what’s made the biggest difference of all.

On that note, I got my second-dose email today… the one asking what I want to do… get a second AZ shot, or wait a bit longer and get Pfizer or Moderna. Given the results I’ve been observing from what’s been published so far, for me, mixing it up with Pfizer might be the way to go.

There’s obviously a lot of discussion going around asking what’s the right move, and the answers differ. The original adage of “get whatever is offered to you” will never be wrong, especially for first doses. Get the one being offered to you. But what about second doses for those who had AstraZeneca for round one?

It’s up to you.

“ASAP” is never wrong.
“The same as the first dose” is not wrong.
“Recent reports imply Pfizer for round two is a good idea” is also not wrong.

Some people are making noise that this goes against the manufacturer’s recommendations and, indeed, NACI’s original recommendation was also against it; stick to what you got.

But, guess what… originally in this pandemic, we were told we wouldn’t need masks. Suddenly, we were told we do. Why? Because it’s all a scam and a sham and fraudulent and Bill Gates and Fauci and 5G and…. No… it’s not that. It’s because *science*. That’s how it works; you learn something new and you course-correct. Nobody was “wrong” at the time; they made their suggestions as best they could; with incomplete information. And as information rolled in, better decisions could be made.

Here’s a decision I hope most people agree with; no matter what flavour it is… get that second dose. It gets us all one step closer, and looking at the pretty graphs and numbers, there’s no doubt we’re going in the right direction.

June 3, 2021

Do you remember learning about convex vs. concave? Which is which? If you have trouble remembering, and are frustrated, go punch a piece of sheet metal… see that indentation? How the sheet is now “CAVEd” in? There you go… conCAVE when it goes in, conVEX when it comes out… like the VEXed expression on the face of the guy on the other side of that sheet, wondering why you did that.

Now that we’re clear on that, let’s look at this new colourful graph I’ve thrown in today… the one on the bottomright. You’ll notice it has three convex lines, a thicker blue one that’s a bit of both, and only one concave one – the thick red Canada line.

Much like the Canada line that runs from downtown to the airport, this one also took a while… and was expensive in its own way… but well worth it in the long run.

This particular Canada line tells a few interesting stories. The first thing that pops out is how ridiculously steep it is in recent months, compared to the others. That’s what happens with a lot of pent-up demand; in fact, you have to wonder if the fact it took so long to hit 5th-gear with our rollout is now contributing to its continuing momentum. Would we have wanted it so badly if it were so easy to get…? Brilliant psychological trick, if that’s what they pulled on us. Either way, it’s showing no signs of slowing down.

The best thing it indicates – exactly what the others don’t – is that we’ve not yet reached the end of the “low-hanging fruit”. We’re still injecting as much of the stuff as is made available, but let’s not fool ourselves; we’re going to plateau at some point, and we will start to look like that thick blue American line… concave to start as demand outweighed supply… followed by that flattening… which is also evident in the three other countries I threw in there; Israel, the UK and Chile. Those three were the world leaders in vaccinations… but once the fanfare wore off and the low-hanging fruit was picked… now it gets more difficult. In the last two months, we’ve gone from 14% to 59%. Israel has gone from 61% to 63%. It’s not difficult to see where the momentum is. Those three countries have entered the post-low-hanging-fruit phase and are entering the vaccine-hesitant phase.

To be clear, nobody is getting to 100%… even here. There’s a solid 10% to 15% of ardent anti-vaxxers in Canada who’d rather get Covid-19 than admit they’re wrong, and nothing will change their mind… so forget about them. That number is higher in other places, and inter-mingles with the vaccine hesitant crowd. Looking at that graph, you’d have to assume a global number of around 65% “yes for sure” vs a sliding scale of 35% that ranges from “yeah, soon, eventually, I will probably…” to “never”.

While it’s impossible to know exactly who any of these lines will eventually shape out, there’s no doubt that Canada will go crashing into first place if current trends continue. Assuming the vast majority of people who get that first does eventually get the second one as well, while it took us a while to get there, we may end up in better shape than anyone else. Doesn’t matter through which sort of lens you use to look at that – convex/concave… whatever… it’s looking good.

Go to Top