Canada

June 6, 2021

Happy Sunday!

You might think there’s nothing good about B.C. being the only province that doesn’t update C19 numbers over the weekend… but you’re wrong!

… because it means… contest time!

I’m not sure how long I can keep doing this, because at some point the numbers get too low… but that’s a good thing. I hope the “It’s not worth running a contest” thing happens sooner than later… but, until it does, we’re doing it again: Take a guess at what the cumulative (Sat/Sun/Mon) new daily cases will be – put your guess in the comments below – and whoever is closest will get (besides *coveted* bragging rights) $100 donated to their charity of choice.

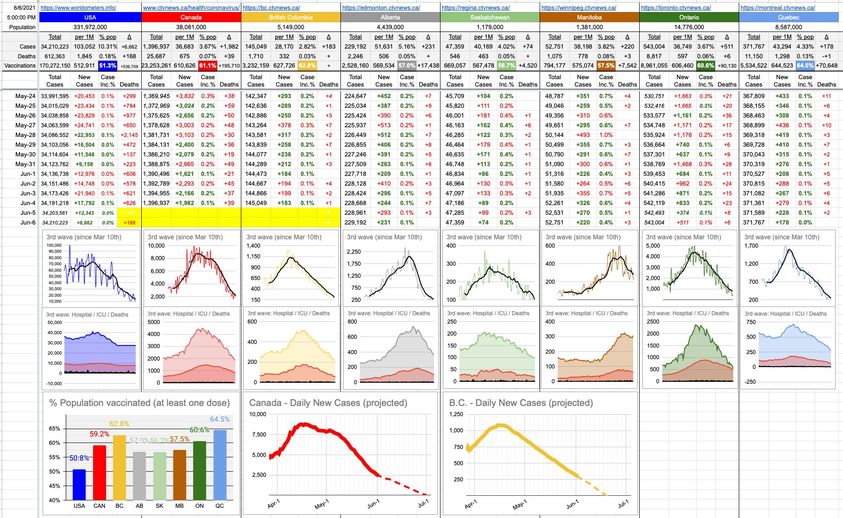
To help you with your integral calculus, statistical analysis, regression… or just good old-fashioned, plain, intuitive guessing… here’s what the last several weekend totals have looked like… and please note the very-encouraging and consistent dwindling towards zero:

Apr 24,25,26: 2,729
May 1,2,3: 2,174
May 8,9,10: 1,759
May 15,16,17: 1,360
May 22,23,24: 974
May 29,30,31: 708

Guesses will be accepted till noon tomorrow. Henry, Dix, Horgan & their associates are banned… but anyone else can play!

Numbers will be released tomorrow at 3pm… and I’ll post the winner at 5pm.

Good luck!

June 5, 2021

There are lots of discussions going on with respect to what exactly happened to the flu this year. It was certainly expected that the social distancing and masking would have an effect, and that numbers would be lower… but nobody really expected it to be virtually zero. The number of pediatric flu deaths in the U.S. this season was exactly one (where it’s normally in the hundreds), and you can be sure that unfortunate kid caught it from a foreign traveller.

How do I know that? Because the flu, like C19, is a virus… and viruses need a breeding population of hosts that they can infect.

Unfortunate side-note for those of you who want to believe in Bigfoot or the Yeti or the Loch Ness Monster or the Ogopogo; perhaps the biggest show-stopper in there being a possibility of them existing is that you can’t have just one. You’d need a breeding population, and it’d have to be significant enough to perpetuate the species. They’d take up a lot of space, and there would be ample evidence (droppings, dwellings) to find, even if not the creatures themselves, whether on land or in the water. It’s not like “I saw *the* Ogopogo”; Lake Okanogan would have to have been teeming with them for centuries.

The masking, and sanitizing surfaces every 10 minutes, had a drastic effect. Flu probably arrived in North America on various airplanes, but died out with nowhere to go. No breeding population of hosts. In fact, so drastic was its demise that there are two common flu strains that may well be extinct. Around the world, there were zero cases reported of two particularly common strains; two that are always part of the annual flu-vaccine concoction. That, on its own, doesn’t yet mean they’re gone forever… but if they don’t show up next year or the year after that… well, it’s a virus. Unlike 200 BigFoots (Bigfeet?) that might be hiding in a cave somewhere in Sasquatch Park, there’s no hiding place for a virus. When the last one has no place to go, it’s gone forever.

It’s ironic that a couple of flu strains might be eradicated simply as “collateral damage”… while C19, with its variety of variants, is going to be around for a lot longer.

The bigger irony would be that Bigfoot actually exists… but gets wiped out by C19, because the humans were unable to eradicate it.

June 4, 2021

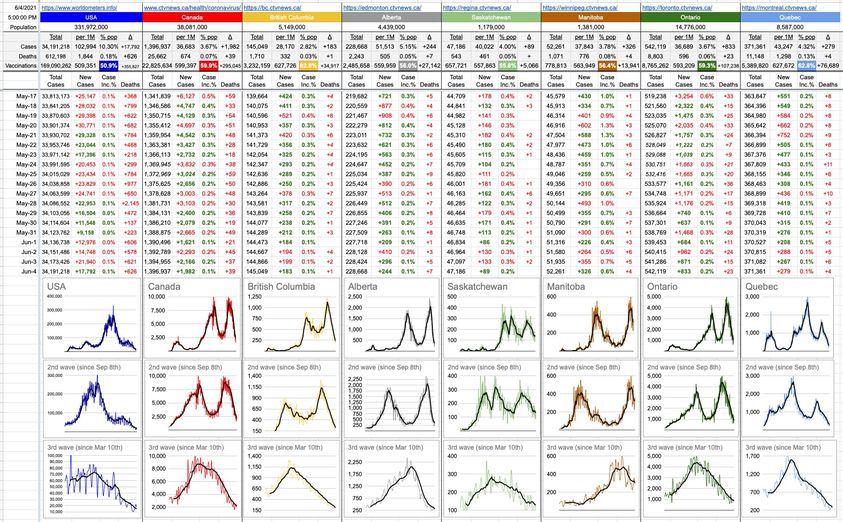
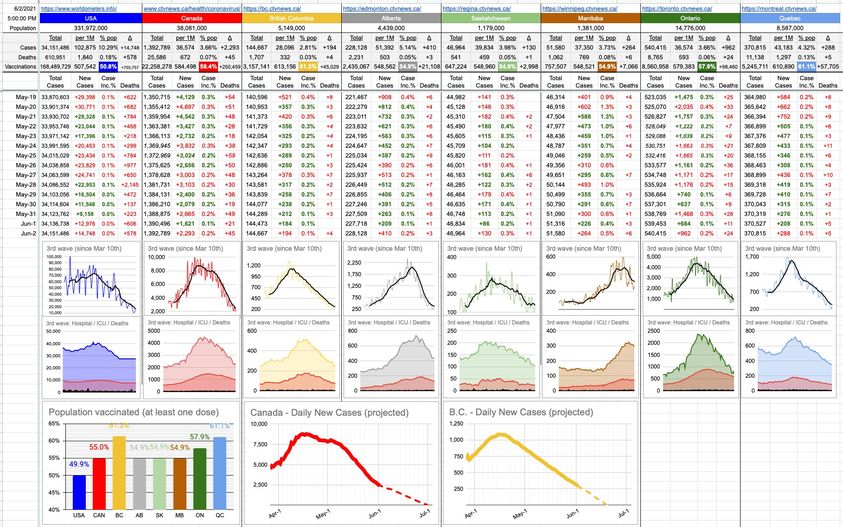
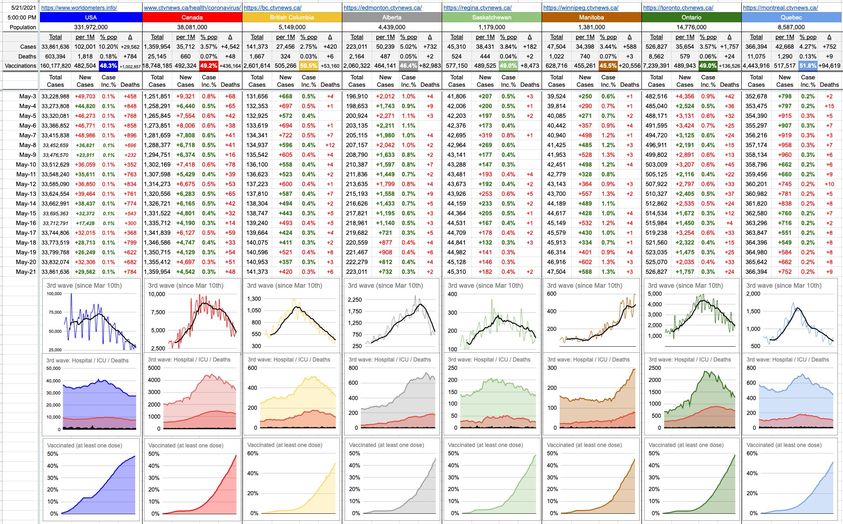
For old time’s sake, I’ve thrown in the graphs showing the progression of this pandemic from day one. If you look below, you’ll see three rows. The first row is the shape of the entire pandemic, going back to Feb 15th of last year. The next row is the second wave onward, starting Sep 8th of last year. You can easily see where that second wave fits into the graph above it. And the third row is the 3rd wave, as of Mar 10th of this year. You can also see where it fits into the one above.

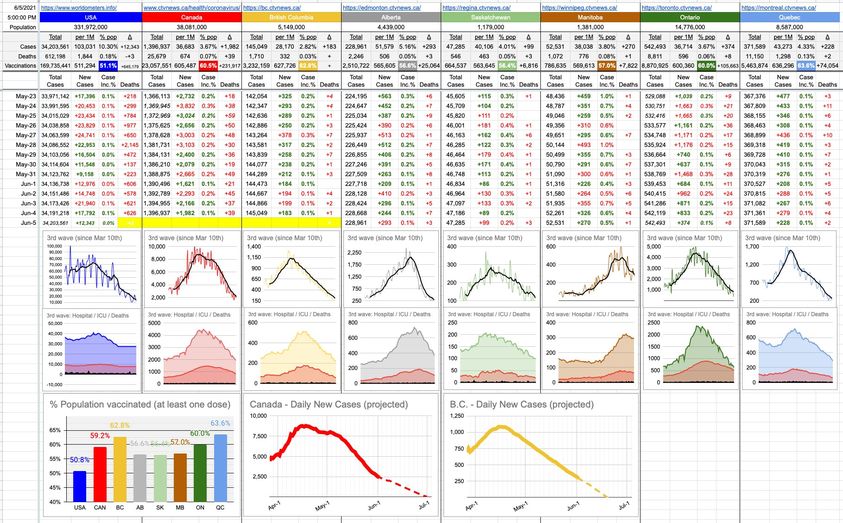
It’s very interesting to note, looking at the column of the 3 B.C. graphs… that our first wave was relatively insignificant in the grand scheme of things; it’s barely a blip in the big picture. That tiny little bump at the bottom left of the top B.C. graph; that’s it. Daily new case counts never broke 100 that entire time… compared to today’s number, +183, which sounds kind of low… and it is. It’s the lowest number since Oct 20th. It’s below what we’re considering the start of the third wave, where, at its worst, we were seeing more than 1,200 new cases a day. The same can be said for hospitalizations and ICU admissions… lowest numbers since November.

Looking at those towering subsequent second and third waves should remind us that, while things are certainly trending in the right direction, it’s not quite over yet. Those flare-ups happened for a number of reasons; reasons which haven’t gone away.

But, of course, one big thing has changed, and it’s not going away… and that is vaccines. And that’s what’s made the biggest difference of all.

On that note, I got my second-dose email today… the one asking what I want to do… get a second AZ shot, or wait a bit longer and get Pfizer or Moderna. Given the results I’ve been observing from what’s been published so far, for me, mixing it up with Pfizer might be the way to go.

There’s obviously a lot of discussion going around asking what’s the right move, and the answers differ. The original adage of “get whatever is offered to you” will never be wrong, especially for first doses. Get the one being offered to you. But what about second doses for those who had AstraZeneca for round one?

It’s up to you.

“ASAP” is never wrong.
“The same as the first dose” is not wrong.
“Recent reports imply Pfizer for round two is a good idea” is also not wrong.

Some people are making noise that this goes against the manufacturer’s recommendations and, indeed, NACI’s original recommendation was also against it; stick to what you got.

But, guess what… originally in this pandemic, we were told we wouldn’t need masks. Suddenly, we were told we do. Why? Because it’s all a scam and a sham and fraudulent and Bill Gates and Fauci and 5G and…. No… it’s not that. It’s because *science*. That’s how it works; you learn something new and you course-correct. Nobody was “wrong” at the time; they made their suggestions as best they could; with incomplete information. And as information rolled in, better decisions could be made.

Here’s a decision I hope most people agree with; no matter what flavour it is… get that second dose. It gets us all one step closer, and looking at the pretty graphs and numbers, there’s no doubt we’re going in the right direction.

June 3, 2021

Do you remember learning about convex vs. concave? Which is which? If you have trouble remembering, and are frustrated, go punch a piece of sheet metal… see that indentation? How the sheet is now “CAVEd” in? There you go… conCAVE when it goes in, conVEX when it comes out… like the VEXed expression on the face of the guy on the other side of that sheet, wondering why you did that.

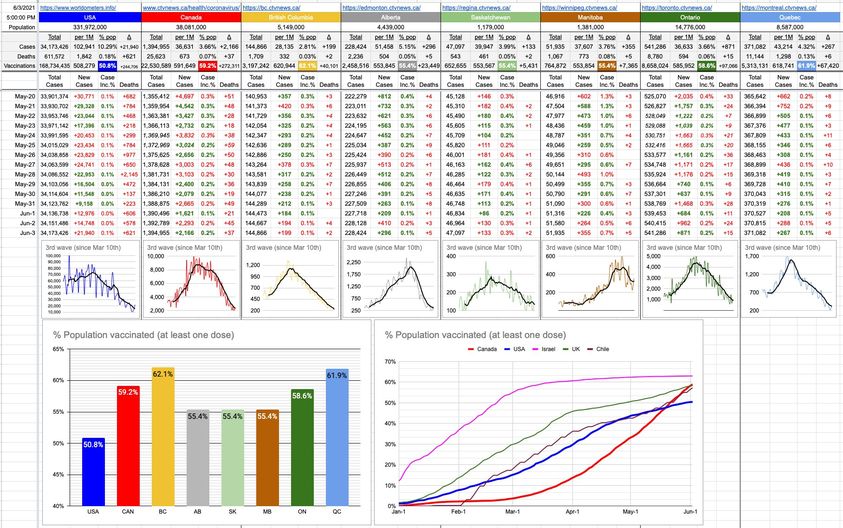
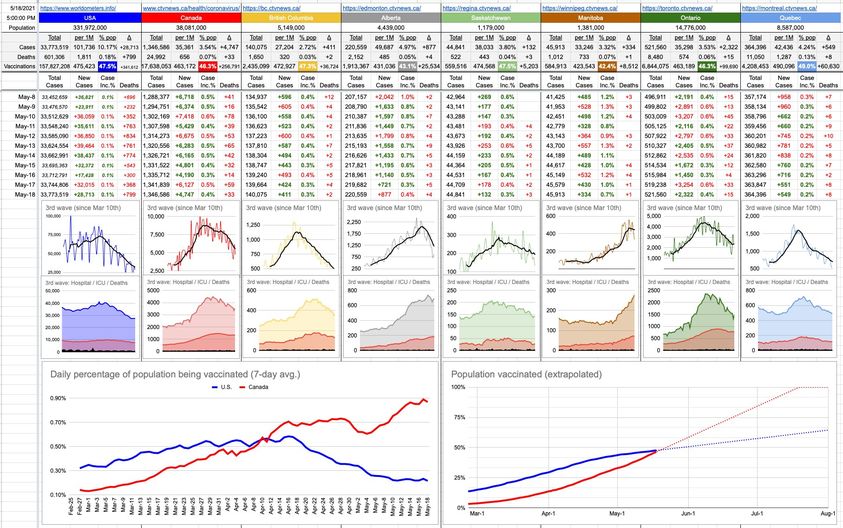
Now that we’re clear on that, let’s look at this new colourful graph I’ve thrown in today… the one on the bottomright. You’ll notice it has three convex lines, a thicker blue one that’s a bit of both, and only one concave one – the thick red Canada line.

Much like the Canada line that runs from downtown to the airport, this one also took a while… and was expensive in its own way… but well worth it in the long run.

This particular Canada line tells a few interesting stories. The first thing that pops out is how ridiculously steep it is in recent months, compared to the others. That’s what happens with a lot of pent-up demand; in fact, you have to wonder if the fact it took so long to hit 5th-gear with our rollout is now contributing to its continuing momentum. Would we have wanted it so badly if it were so easy to get…? Brilliant psychological trick, if that’s what they pulled on us. Either way, it’s showing no signs of slowing down.

The best thing it indicates – exactly what the others don’t – is that we’ve not yet reached the end of the “low-hanging fruit”. We’re still injecting as much of the stuff as is made available, but let’s not fool ourselves; we’re going to plateau at some point, and we will start to look like that thick blue American line… concave to start as demand outweighed supply… followed by that flattening… which is also evident in the three other countries I threw in there; Israel, the UK and Chile. Those three were the world leaders in vaccinations… but once the fanfare wore off and the low-hanging fruit was picked… now it gets more difficult. In the last two months, we’ve gone from 14% to 59%. Israel has gone from 61% to 63%. It’s not difficult to see where the momentum is. Those three countries have entered the post-low-hanging-fruit phase and are entering the vaccine-hesitant phase.

To be clear, nobody is getting to 100%… even here. There’s a solid 10% to 15% of ardent anti-vaxxers in Canada who’d rather get Covid-19 than admit they’re wrong, and nothing will change their mind… so forget about them. That number is higher in other places, and inter-mingles with the vaccine hesitant crowd. Looking at that graph, you’d have to assume a global number of around 65% “yes for sure” vs a sliding scale of 35% that ranges from “yeah, soon, eventually, I will probably…” to “never”.

While it’s impossible to know exactly who any of these lines will eventually shape out, there’s no doubt that Canada will go crashing into first place if current trends continue. Assuming the vast majority of people who get that first does eventually get the second one as well, while it took us a while to get there, we may end up in better shape than anyone else. Doesn’t matter through which sort of lens you use to look at that – convex/concave… whatever… it’s looking good.

June 2, 2021

Shocking news to report… we didn’t win the Lotto Max. And… nobody else did, either. I’ll spend a bit of time analyzing whether what I predicted was in any way statistically significant. Of the top 10 tickets generated, 5 of the 7 numbers picked were on them. Never more than 2 together though. I’m not sure if a monkey throwing darts would’ve done better, worse, or simply the same.

In the meantime, other numbers… my vaccination numbers and graphs differ from the official ones because I’ve never used “eligible people” as a denominator; I’ve always simply used everyone. That two-month-old baby? One day he’ll get a C19 vaccine – not sure when… but as far as vaccinated/not-vaccinated, I’m counting him.

As such, here’s something interesting; in Canada, at this moment, B.C. has taken the lead with respect to vaccinated population. We’ve vaccinated 61.3% of everybody (at least one jab). Now in second place is Quebec (61.0%). The country overall is at over 58.4% with at least one dose (which is really good), and 6% fully vaccinated (that certainly has a ways to go).

The next big issue will be vaccine passports or immunity certificates or green passes or whatever you want to call them. Many countries and even some provinces are starting to talk about how it’ll look, how it’ll be implemented and how it will affect things. The “Freedumb!!” crowd will start screaming, etc… perhaps without realizing that vaccine passports in some fashion have been around for centuries, and many places have always required them… for your protection as well as theirs. Of course, the vast majority of people complaining are not those who typically travel to malaria-infested river basins or parts of the world known for Dengue Fever outbreaks.

Just remember, the couple dining next to you in the restaurant has rights too. They have to the right to know they’re in a safe environment. And the restaurant itself has rights too… to do whatever they want to provide that.

May 28, 2021

What you read here is often thought up while I’m lost in thought, riding my bike… and today, I started by thinking about this crazy anti-vaxxer who decided to drive her car through a vaccination tent set-up in a parking lot in Tennessee. Fortunately, nobody was hurt… but there were plenty of near-misses. I was pondering from which angle to approach that – and there are many – and was specifically thinking about how some people are just assholes, plain and simple… and while having that illuminating thought, the following happened…

I was cycling on the seawall, near English Bay, heading west… somewhere between the Burrard Bridge and Cactus Club… it’s a nice stretch of road between BB and CC these days – a whole street lane dedicated for bikes. As such, there is plenty of room for two-way bike traffic… and what I saw was a guy on a bike, coming towards me. There was also a Canada Goose sitting on the street, right next to the curb. This guy had plenty of room to go by… enough room that he had to make an extra effort to stick out his right leg and kick the bird as he went by. This happened about 20 feet in front of me. The goose wasn’t seriously hurt… it just squawked and fluttered a bit. But I slammed on the brakes and yelled after him… I guess what one would call a declarative sentence – like “Have a nice day!” – except that’s not what I said. He barely slowed down and didn’t look back; just held up one solitary finger as he rode off into the distance. Seriously, what an asshole.

I resumed my ride now trying to figure out where the overlap of assholes might fit into what I have to say; what does a psycho-anti-vaxxer have in common with a guy who kicks an innocent bird for no reason?

The quick conclusion I came to is that I’ve already wasted enough time thinking about these pieces of crap… so we’ll leave it at that.

Moments later, I saw a sign that announced that tonight’s Lotto Max is up to $65 million… so I started thinking about how I might analyze previous draws, and try to use that to predict future ones. Turns out there’s 4,000 draws of historical data to analyze, and that’s what I’m doing right now… potentially far more rewarding than writing about assholes. With some intelligent analysis, I might reduce the odds of winning from a gazillion to one to just one in a zillion.

So… on that note… I’m going to get back to it now… still a few hours before the draw… wish me luck… and if you’ve read this far, tell you what… if I win $65 million dollars, I’ll take $5m of it and split it with everyone who likes this post.

May 27, 2021

You’ve heard me say, “Start at the finish line and work backwards from there.” It’s a strategy that’s served me well in life, and looking at today’s B.C. graph reminded me of something.

Back in high school, grade 12 — our science teacher wanted us to figure out absolute zero experimentally. This isn’t a complicated experiment; it’s simply based on the assumption that the volume of a gas changes with temperature. The hotter the gas, the more space it wants to occupy… so if you’ve got the gas locked into a fixed-volume chamber, by measuring the pressure at different temperatures, you can learn a lot.

Side-note… I got into an argument once with someone who insisted that it’s possible to have a temperature colder than absolute zero. Given that temperature is really just measuring the speed of molecules, and that absolute zero is the speed at which they stop, I think it’s impossible for anything to be colder that that… in much the same way it’s impossible for your car to be going any slower than “stopped”. If any experts want to tell me how it might be possible, I’m listening. In fact, like the speed of light, I believe you can’t even get to it… you can just get really close… but if you reach it, all sorts of universal rules break down.

Anyway, with this experiment, you measure the pressure of the gas at different temperatures… and then you graph it. You plot the points on a graph; pressure vs. temperature. And since this is a linear relationship, you should be able to find the temperature by finding the line that cuts through all the data points and then eventually hits the graph at zero. This process is called extrapolation… where you take certain data, figure out the rules that apply to it, and make intelligent guesses with data points you haven’t actually measured experimentally. If your car passes a fence post every 10 seconds at 50km/h, can you figure out how fast you’d need to be going if you wanted to pass a fence post every one second? You can measure and graph it at 50, 100 and maybe even 150km/h… and if you plot that, there’s a perfect straight line to show you you’d need to be going 500km/h. Much easier than trying to do it experimentally.

Of course, if you’re relying on the graph to give you the answer, it’s important the measurements be accurate because a couple of dots just a bit off will move the line significantly. An extrapolation of absolute zero that’s +/- 3 degrees of the real answer is a good result.

But I chose to start at the finish line… and found exactly where, on the graph, absolute zero would be (-273.15 C.)… and drew my line from there to my first data point. And then, magically, all of my results landed perfectly onto the line.

When the teacher was handing back the lab books next class, he stopped at my desk.

“Congratulations on your excellent result, Mr. Kemeny.”

“Thank you, sir.”

“Don’t you find it extraordinary that, armed with just some rudimentary equipment, you managed to find a result accurate to within a 10th of a degree?”

“It’s quite remarkable, sir.”

“How do you explain it?”

“It must be due to the excellent science instruction I’ve been receiving in this course, sir.”

“Thank you, but I’m not that good. Please keep in mind, Mr. Kemeny, that life rarely offers you shortcuts.”

“I suppose that means that when it does, we should take them?”

He just handed me back the lab book. I got 8/10. Everyone else got 10. I didn’t argue.

Looking at today’s B.C. graph, it’s a linear descent towards zero new cases a day. Like bad data, a couple of bad days can significantly affect the landing point, but until it does, let’s have a bit of fun with the numbers.

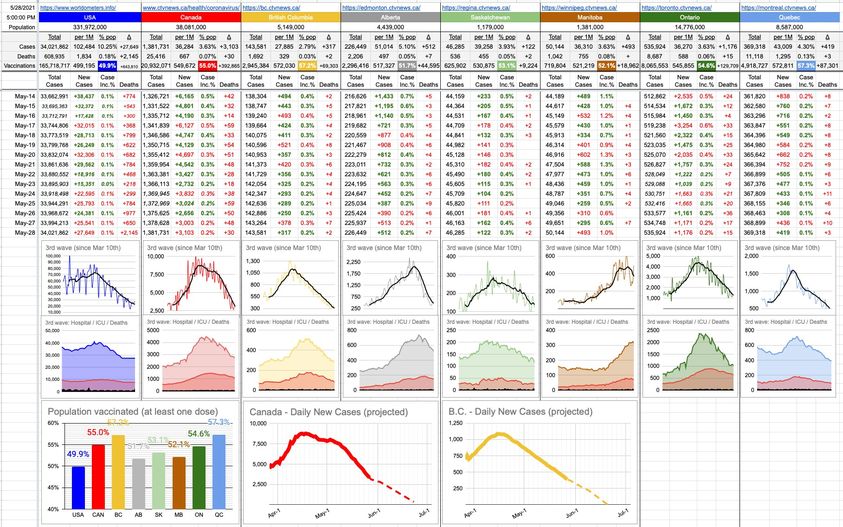
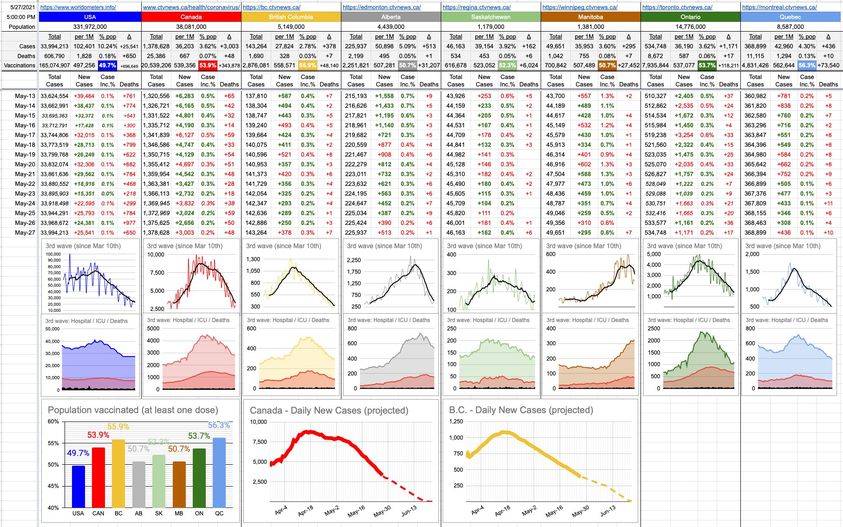
You’ll see below three new graphs. The first one is a consolidation of all of the vaccination rate graphs. Yes, we get it, they’re all going up, nobody is getting un-vaccinated, and those graphs are small enough that the nuanced differences between provinces are indistinguishable. So now, they’re all on one graph… if you want to compare apples to apples.

The other two graphs, as per above, are extrapolations… one is Canada and the other is B.C. The thick line is the real data up to today. The dotted line is where we’re headed if nothing changes. This is still very much a work in progress… so, we shall see. I’m no expert… just some guy plotting points and drawing lines.

It’d be nice to be able to work backwards; certainly, it’s what our provincial health ministry has tried to do with our 4-step re-opening plan… but here we’re stuck doing the actual experiment… and, it should be noted… if these numbers and graphs are anywhere close to reality, we will easily achieve the targets of out provincial 4-set plan. I’d certainly give that a well-deserved 10/10.

May 24, 2021

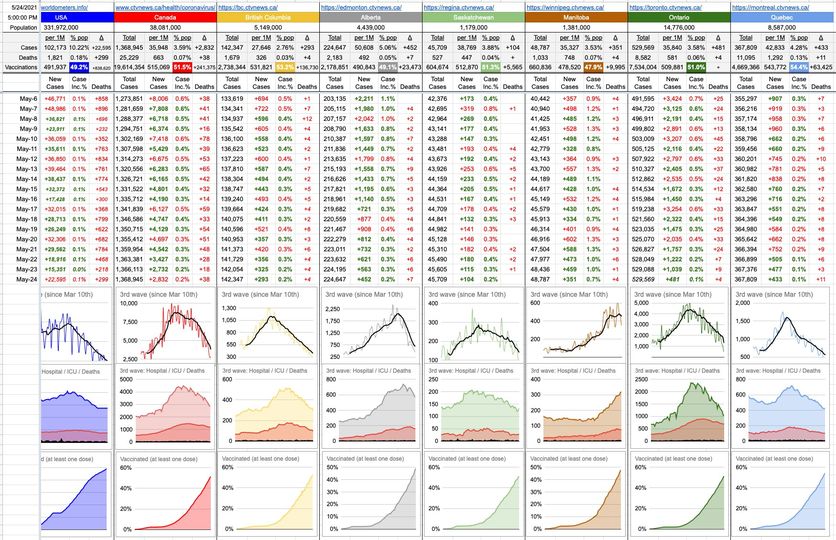
These long weekends used to scare me a bit because it’s like flying blind for a few days. We might wake up Tuesday morning to find 3,000 dead and 400,000 new cases. It never happened (not even close), thankfully, and I guess that’s why when B.C. decided to pull the plug on weekend updates, they never came back. But I certainly appreciated they updated numbers today… and they were as good as we can hope for… beautifully following that descent to zero. Today’s less-than-300 new cases was the lowest since Feb. 1st… before the 3rd wave.

For the most part, the other interesting numbers to follow these days (barring a 4th wave appearing suddenly and out of nowhere) are the vaccination numbers. On a per-capita basis, we’ve pulled ahead of our southern neighbours, and it’s to no great surprise. We are vaccinating as fast as we can; they are not.

Other broad brush strokes… our military is 85% vaccinated, and that number would be higher were it not for logistics… so it’ll keep rising. On the flip side, the American military refusal rate is somewhere between 33% and 50%, depending who you ask.

Military aside, what about the general population?

In the U.S., it looks like this…

Democrats: 67% vaccinated + 24% asap or waiting = up to 92% eventually, with 8% saying never.

Republicans: 46% vaccinated + 22% asap or waiting = up to 68% eventually, with 32% saying never.

In Canada, it looks like this…

Already vaccinated or will eventually / outright refusal:

NDP: 79% / 9%

Liberal: 84% / 5%

Conservative: 69% / 19%

Seriously, what is it with right-leaning mindsets? Why does conservative equal vaccine hesitancy? Is it because they don’t trust the government? Is it because they don’t trust science? Is it because it’s not in the bible? Or it IS in the bible in some hidden way?

The first time I ran across this sort of horseshit was when I was only 13 and it was pointed out to me that the new American president (Ronald Wilson Reagan) had 6 letters in each of his names. 666… the sign on the beast. Clearly, he was the anti-christ… notwithstanding he was himself a staunch Republican. Seems about as valid as the fact that Reagan can be spelled/pronounced Ray-gun – queue the space lasers and World War III.

If you like this sort of nonsense, get this:

C=3
O=15
R=18
O=15
N=14
A=1
——
6 66 — run for the hills!!!!

… or just trust the science and get vaccinated. Jeez.

May 21, 2021

If you look at the B.C. chart below, you’ll notice that the black 7-day moving average of cases is remarkably consistent. You could put a ruler to it and not be far off. Someone asked, given that slope, when would we see zero cases?

Extrapolating it, if it stays that consistent, we’d hit zero on June 16th. There’s a picture of it in yesterday’s comment section. Is that actually possible?

Above and beyond the restaurant closures and social restrictions and masks and all the rest of it, is the very real and excellent fact that lots and lots of us are getting vaccinated. Let’s remember… this is a virus, not a live bug. It needs a host. If the virus has exhausted its time on a particular host and wants to go elsewhere, it needs to find a viable destination. A host that’s not immune… and that’s, fortunately, becoming more and more rare.

So… what does that mean for a return to normality?

We’ve been told we need to exceed 75% / 20%… meaning 75% of people with at least one jab and 20% fully immune with two.

If 50% of the population has one jab and 3% of the population has two jabs, what’s the shortest period of time it could take to get to 75% / 20%?

OMG, it’s your worst nightmare coming to life – an actual real-world application of a math *word problem* – the sort your prof promised you’d never have to deal with if you study really hard and just pass this one last final math exam. Wait, come back! – sit down… I’ll do it for you.

We’ll make the math conveniently easy, because it’s very close to this; we are 38,000,000 people and we are vaccinating 380,000 people a day. Exactly 1%. And note that not all 38M can get vaccinated, and that 380,000 number could go up… so these numbers are conservative.

If the intent were to get to 75 / 20 as fast as possible, we’d have to allocate vaccine so that, on a daily basis, we’re incrementing both of those numbers in such a way that we hit 75 / 20 simultaneously… but a simple way to look at it is to get to 75 right away, and given the present strategy, it’s almost what’s happening… all first jabs. In 25 days, well before the end of June, , we’ll be there. And then, there are only 17 days needed for second jabs… if you stop giving people the first ones entirely for 2.5 weeks.

So… might I suggest this strategy… keep red-lining first jabs for another three weeks… that’ll get us to 71% by June 11th, and then, start splitting doses 50/50 till Canada Day… at which point we’ll be at 81% / 14%… and then, spend a week primarily on second doses. Then, another couple of weeks for all of that to kick in. If we do that, by the fourth week of July, we’d theoretically be ready to throw open the border.

We were far behind with our vaccine rollout, but we’re catching up. Perhaps we’re a bit behind with our “back to normal” rollout too, though I still believe in “better safe than sorry.”

But… around here, restaurants are opening up on Tuesday… and given everything I know now, and given that I’d be surrounded by people who already have one or two doses in them… yeah, why not… you might find me in one of them sooner than later.

May 18, 2021

There are plenty of different racing styles when it comes to horses, but as the far extremes go, it’s like this:

On one ends of the spectrum are horses that have only one gear… the “GO” gear. Most jockeys are unable to control these horses’ pace, so there’s no sense in trying; it only frustrates the horse… and uses up their energy anyway. So… they let the horse floor it, and the horse sprints to the front… and you hope there’s enough gas in the tank (ie. stamina) to hold that lead to the end.

On the far other end of the spectrum are horses who are in no hurry. They’ll start slow, sit dead last, and at some point, hopefully, find another gear or three to make a late run for it.

The latter ones are the most nerve-wracking… whether you own/train/groom the horse… or just bet a few bucks on it, seeing it dead last by half a mile is never a relaxing experience. I can think of many examples of horses coming from out of nowhere, but perhaps the best example is the 2009 Kentucky Derby; that’s worth a look on YouTube if you’ve never seen it. The winner, Mine That Bird, a 50-1 longshot, was so far out of it, you can barely see him in most of the video. At one point, the announcer loses track of the fact that there’s yet another horse behind the one he thought was last. What happens next is quite remarkable. Look for the #8 horse with the pink saddle cloth.

Similarly, Canada, in the horse race of vaccination, was a good 40 lengths behind the leaders, taking its time while everyone sprinted off towards the finish line. But recently, Canada, like Mine That Bird at the quarter pole, managed to find a gear nobody was expecting.

In the next day or two, as per the numbers and pictures below, Canada will have, per capita, more first injections into people than the U.S… and we’re blowing by other countries at the same pace Mine That Bird reeled-in his competition.

Recently, Canada, on a daily basis, is averaging vaccinating around 0.9% of its population. The U.S. never really got above 0.7%, and now they’re averaging around 0.2%… and today, they barely managed 0.1%. It’s like one horse, in top gear, screaming down the lane… and the other one, out of gas, easing back… out of contention. Up ahead, the jockey on Canada (I guess that’s all of us, collectively) can see some other front-runners starting to tire… Chile, Hungary, the U.K. We’re going to pass them all.

That being said, a win here is not finishing ahead of anyone; a win here is everyone hitting the line together, sooner than later… and there are two issues that conspire to prevent that: supply and demand, often at odds with each other.

In Canada, we have lots of both, and the politicians weren’t lying; the infrastructure to deliver everything we can get our hands on is in place, and it’s working very well. We’re taking full advantage of it. Until recently, I thought my 17-year-old daughter wouldn’t be vaccinated for another few months. It’ll actually be in another few… hours.

How long will this momentum last? When you assume infinite supply, it all comes down to demand… and that’s the wall the U.S. has hit. Everyone who wants a vaccine has had every opportunity to get one, so now it’s a trickle of people, not the full-on stampede we’re experiencing here.

The real win, for any particular country, province, state, region, whatever… is to surpass the threshold of herd immunity. The U.S., by virtue of vaccinations alone, will not get there. At least 25% of Americans have flatly stated they refuse to be vaccinated. Unless they change their mind, their theoretical best-case scenario is 75%.

Will Canada? It remains to be seen. Our “No way I’m getting vaccinated!!” number is 9%… while 88% of Canadians have said they will or already have. If we don’t “run out of horse”, at the current pace, we’ll be hitting that threshold by mid-June. In fact, at the current pace, we’d theoretically hit 100% by mid-July.

It’ll be interesting to see at what point that line flattens out. Anything north of 80% would be huge… and I wouldn’t bet on it exceeding 85%… but then again, I didn’t bet on Mine That Bird either, so who knows; once in a while, those long-shots pay off… and if this particular horse comes in, it doesn’t matter who you bet on… we all win.

Go to Top