June 2, 2021
Shocking news to report… we didn’t win the Lotto Max. And… nobody else did, either. I’ll spend a bit of time analyzing whether what I predicted was in any way statistically significant. Of the top 10 tickets generated, 5 of the 7 numbers picked were on them. Never more than 2 together though. I’m not sure if a monkey throwing darts would’ve done better, worse, or simply the same.
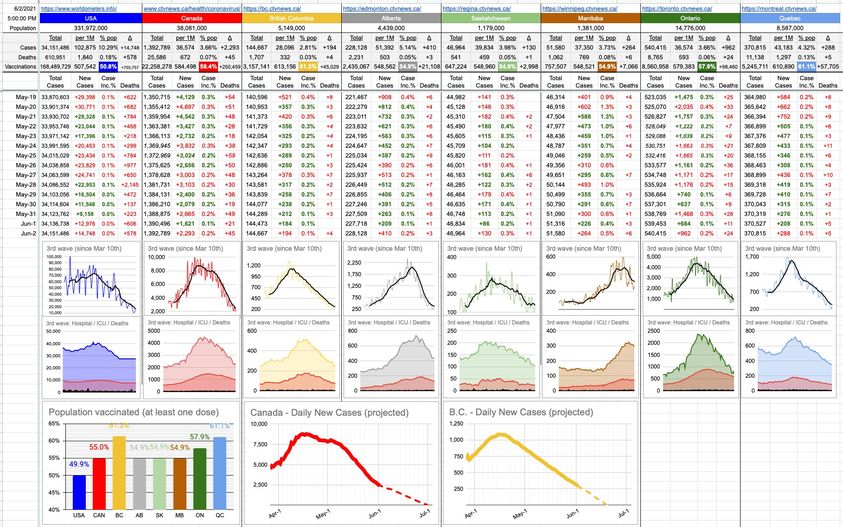
In the meantime, other numbers… my vaccination numbers and graphs differ from the official ones because I’ve never used “eligible people” as a denominator; I’ve always simply used everyone. That two-month-old baby? One day he’ll get a C19 vaccine – not sure when… but as far as vaccinated/not-vaccinated, I’m counting him.
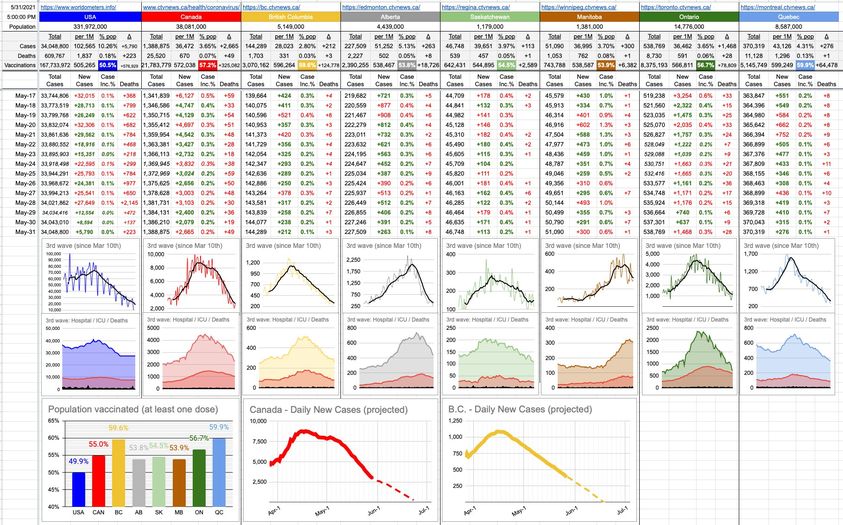
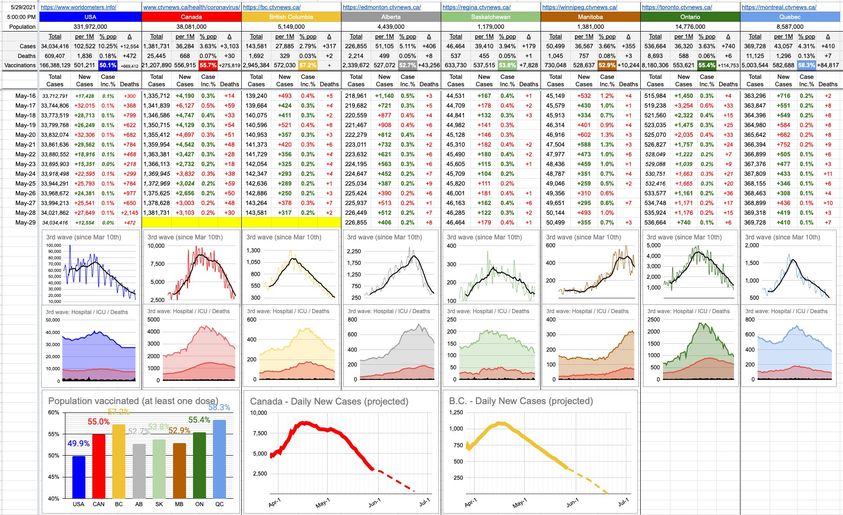
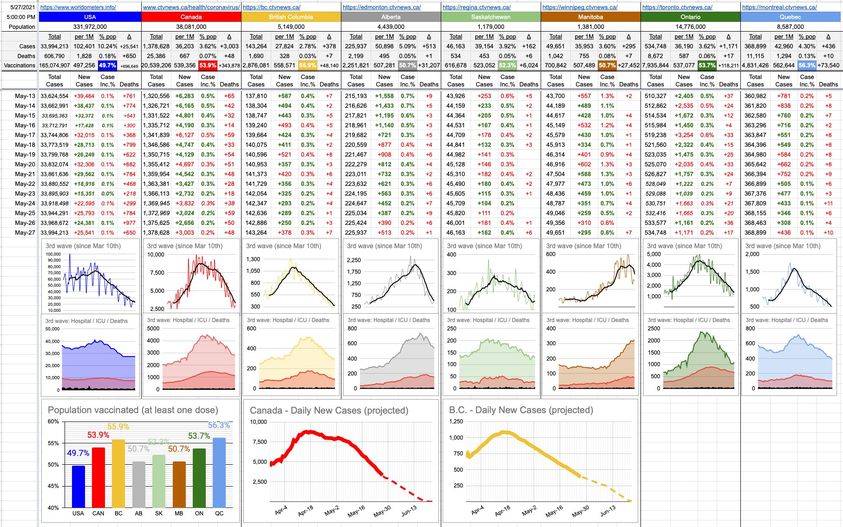
As such, here’s something interesting; in Canada, at this moment, B.C. has taken the lead with respect to vaccinated population. We’ve vaccinated 61.3% of everybody (at least one jab). Now in second place is Quebec (61.0%). The country overall is at over 58.4% with at least one dose (which is really good), and 6% fully vaccinated (that certainly has a ways to go).
The next big issue will be vaccine passports or immunity certificates or green passes or whatever you want to call them. Many countries and even some provinces are starting to talk about how it’ll look, how it’ll be implemented and how it will affect things. The “Freedumb!!” crowd will start screaming, etc… perhaps without realizing that vaccine passports in some fashion have been around for centuries, and many places have always required them… for your protection as well as theirs. Of course, the vast majority of people complaining are not those who typically travel to malaria-infested river basins or parts of the world known for Dengue Fever outbreaks.
Just remember, the couple dining next to you in the restaurant has rights too. They have to the right to know they’re in a safe environment. And the restaurant itself has rights too… to do whatever they want to provide that.
June 1, 2021
We’ll get back to vaccines and pandemics and all of the related issues… tomorrow.
But tonight… the idea is to try to win $70 million in Lotto Max.
Figuring out lottery odds is pretty simple. Using factorial notation (where 4! = 4 x 3 x 2 x 1), when there are 49 numbers to choose from and you have to hit exactly the right 6 (like Lotto 6/49), the formula is ( 49! / (49-6)! x 6! ) – which is just under 14,000,000 to 1. When you add a 7th number in there, like for Lotto Max, the odds shoot up to over 80,000,000 to 1. So, they go from impossible to… impossible.
That being said, let’s take a crack at it; here’s what I did…
I wrote a little program that does a number of things:
– It reads in all of the historical draws (~4,000)
– It figures out how often every number (1-49) has come up in the last 10, 40, 100 and all-time draws
– It figures out, for each number, what other numbers are likeliest to come up together… based on those historical draws.
– It generates, and then scores, all 86,000,000 possible draws
That last step is a doozy… it generates every single potential draw of 7 numbers… from 1,2,3,4,5,6,7 to 43,44,45,46,47,48,49… and then, based on the history, assigns a “likelihood” score to it.
If anyone is interested in the source code or results of any of this, feel free to ask. For all the geeks out there, I’m especially proud of my function that generates all of those draws… it’s a recursive function that’s only 7 lines long.
Anyway, I think I’ve sunk enough time into this… now I’m going to sink some money into it and, like last time, I’m happy to share $5 million of my jackpot winnings with all of you. If you want a piece of it, just like this post.
Apologies ahead of time if we don’t win and, either way, back to normal tomorrow.
Unless we win. Then… things will be far from normal.
May 31, 2021
Well… that was a fun little contest. We will do it again in future for sure.
Shout-out to the two extremes…
The pessimist award goes to Lyn Garnier’s guess of 1,123.
The optimist award goes to Larry Lacoursiere’s guess of 362
Also, shout-outs to the “pretty-close” club:
Nicky Owers’ guess of 699 missed by 9
Denise Praill’s guess of 714 missed by 6
Cadence Jensen’s guess of 807 had all the right digits… backwards.
So… congrats to Andy Sellars – whose guess of 712 missed the actual 3-day total (258+238+212) of 708 by only 4.
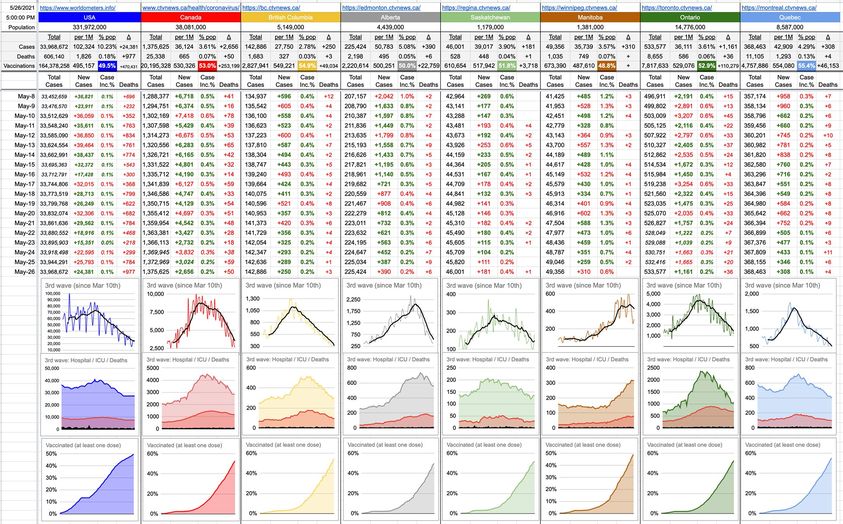
To put these numbers in context… this is the best weekend we’ve had since October, and that linear descent continues to hold. I’m sure it’ll tail off eventually, at some point, but for now… it looks very good. If this continues, we’d be down to single-digit case counts by the third week of June. Who knows… all of this is certainly being helped by the fact that we just crossed a significant milestone… more than 3,000,000 B.C. individuals have had at least one dose.
Andy, well done! Please let me know your worthy charity of choice.
And the rest of you, sharpen your pencils and/or clear your spreadsheets; we’ll do it again next week.
May 30, 2021
The last little contest that I held was to guess where on earth, literally, that remnant Chinese rocket was going to hit. The result of that was no human deaths, but a $100 donation to a Search & Rescue team on the island.
Let’s do this again… with, this time, little chance of anyone getting clobbered by space junk.
You’ve heard me say for more than who-knows-how-many consecutive weekends… “No B.C. numbers to report, so we’ll wait for tomorrow…”
So… let’s make some good of it… here’s the contest:
Give me your best guess as to the total weekend numbers… new daily case counts for Saturday, Sunday and Monday combined… and, whoever is closest will win $100… donated, in their name, to their charity of choice.
To help you guess a little, here are the last several Sat-Sun-Mon totals:
May 22,23,24: 974
May 15,16,17: 1,360
May 8,9,10: 1,759
May 1,2,3: 2,174
Before that: 2,729
That’s a good-looking trend; may it continue.
Fire off your guesses and good luck – contest entries will be accepted till noon tomorrow.
May 29, 2021
OK… the bad news is we didn’t win 65 million dollars. The good news is that nobody else did either, so we get to take another crack at it… this time, with a few more days to grind through the numbers and some new ideas… which might lower the chances from one in 33 million to something a little more reasonable. To put that in context, your chances of getting a blood clot from a C19 vaccine are about 100x greater… and those chances are exceedingly remote already… to the extent that your chances of getting hit by lightning in your lifetime are 200x greater than a C19-vaccine blood clot. Yeah, you read that right. Still worried?
For those assuring me there’s no rational way to predict the lottery, you’re almost certainly right, but I don’t mind telling you what I’m trying to do here… which is to find some tangible edge, if it exists.
For example… let’s briefly talk about Roulette; the casino game where there’s a wheel, with the numbers 1 to 36 on it, as well as a zero, and often (in the American version), a double-zero. Except for the zeroes, half the numbers are red, the other half black. Half are even, half are odd. Half are 1-18, half are 19-36. If you bet a dollar on any of those, you’ll double your money if you’re right. But if you want to win the real money, you have to bet on numbers straight up… where a 37-1 chance pays 35-1.
Here’s an unusual talent of mine; if you give me any number on an American roulette wheel, I can instantly give you the three numbers to either side of it. Like, 32…? 5 7 11 17 20 22 32… and I can bet them all straight-up in about two seconds. I realize this is less impressive in writing; when this is all over, let’s head to the casino and I’ll show you how to win at roulette… maybe.
The maybe has to do with whether the wheel, at that moment, is truly random or not… and usually it is. But, once in a while, especially near the end of a long day, it may be a bit off. A bit of humidity is slowing down part of it, or maybe there’s some dust that’s accumulated on a particular spot, causing the ball to “bite”, right at that point. Whatever the reason, it may temporarily be not so random.
Conveniently, these days, there’s an electronic board showing you the last 20 numbers that have come up. It often looks like a completely random jumble of numbers; like, true randomness. But… if you know what you’re looking at… let’s say you see 22 11 32 7 5 17 as the last 6 numbers. As per above, you’d instantly know those numbers are all in a tight, specific section of the wheel… and so you sit down and you hammer that area of the weel — straight up. Often, it’s not so obvious… but if five of the last ten numbers are all on the same pie-slice of the wheel, it’s a big opportunity.
That is how I play Roulette, and that is how I’m trying to approach the lottery.
There are 49 ping-pong balls of equal weight that bounce around randomly, and then 7 are chosen. All things being equal, it’s totally random. But what if some of those balls are slightly heavier or lighter? What if, by the design of the way the balls are dropped in the tumbler, some generally stay closer to the hopper?
I’m sure everything is checked often, but let’s say recently a few balls picked up some dust… making them likelier (or less likely) to come up. Or some calibration is a little out of whack.
I really don’t know the mechanics of it, but I’m studying the frequency of numbers that have come up recently… and comparing it to, historically, whether these sorts of patterns emerge from time to time. It’s interesting to note that numbers that end in 1 seem to come up more often. A 31 on its own is one thing, but 1, 11, 21 and especially 31… have a degree of consistency that others don’t. Not sure how significant that is, and 4,000 draws out of a potential 33 million doesn’t make much of a dent in “the big picture”. But anyway, that’s what I’m doing… trying to figure out what numbers are likeliest to come up these days… and then coupling that with, historically, what numbers are likeliest to come up together with those likelier numbers… like, if I think 31 is going to come up, what else is likeliest to show up? With that, I’m generating sets of numbers… and that’s what I’ll… uhh… “invest”. Stay tuned…
May 28, 2021
What you read here is often thought up while I’m lost in thought, riding my bike… and today, I started by thinking about this crazy anti-vaxxer who decided to drive her car through a vaccination tent set-up in a parking lot in Tennessee. Fortunately, nobody was hurt… but there were plenty of near-misses. I was pondering from which angle to approach that – and there are many – and was specifically thinking about how some people are just assholes, plain and simple… and while having that illuminating thought, the following happened…
I was cycling on the seawall, near English Bay, heading west… somewhere between the Burrard Bridge and Cactus Club… it’s a nice stretch of road between BB and CC these days – a whole street lane dedicated for bikes. As such, there is plenty of room for two-way bike traffic… and what I saw was a guy on a bike, coming towards me. There was also a Canada Goose sitting on the street, right next to the curb. This guy had plenty of room to go by… enough room that he had to make an extra effort to stick out his right leg and kick the bird as he went by. This happened about 20 feet in front of me. The goose wasn’t seriously hurt… it just squawked and fluttered a bit. But I slammed on the brakes and yelled after him… I guess what one would call a declarative sentence – like “Have a nice day!” – except that’s not what I said. He barely slowed down and didn’t look back; just held up one solitary finger as he rode off into the distance. Seriously, what an asshole.
I resumed my ride now trying to figure out where the overlap of assholes might fit into what I have to say; what does a psycho-anti-vaxxer have in common with a guy who kicks an innocent bird for no reason?
The quick conclusion I came to is that I’ve already wasted enough time thinking about these pieces of crap… so we’ll leave it at that.
Moments later, I saw a sign that announced that tonight’s Lotto Max is up to $65 million… so I started thinking about how I might analyze previous draws, and try to use that to predict future ones. Turns out there’s 4,000 draws of historical data to analyze, and that’s what I’m doing right now… potentially far more rewarding than writing about assholes. With some intelligent analysis, I might reduce the odds of winning from a gazillion to one to just one in a zillion.
So… on that note… I’m going to get back to it now… still a few hours before the draw… wish me luck… and if you’ve read this far, tell you what… if I win $65 million dollars, I’ll take $5m of it and split it with everyone who likes this post.
May 27, 2021
You’ve heard me say, “Start at the finish line and work backwards from there.” It’s a strategy that’s served me well in life, and looking at today’s B.C. graph reminded me of something.
Back in high school, grade 12 — our science teacher wanted us to figure out absolute zero experimentally. This isn’t a complicated experiment; it’s simply based on the assumption that the volume of a gas changes with temperature. The hotter the gas, the more space it wants to occupy… so if you’ve got the gas locked into a fixed-volume chamber, by measuring the pressure at different temperatures, you can learn a lot.
Side-note… I got into an argument once with someone who insisted that it’s possible to have a temperature colder than absolute zero. Given that temperature is really just measuring the speed of molecules, and that absolute zero is the speed at which they stop, I think it’s impossible for anything to be colder that that… in much the same way it’s impossible for your car to be going any slower than “stopped”. If any experts want to tell me how it might be possible, I’m listening. In fact, like the speed of light, I believe you can’t even get to it… you can just get really close… but if you reach it, all sorts of universal rules break down.
Anyway, with this experiment, you measure the pressure of the gas at different temperatures… and then you graph it. You plot the points on a graph; pressure vs. temperature. And since this is a linear relationship, you should be able to find the temperature by finding the line that cuts through all the data points and then eventually hits the graph at zero. This process is called extrapolation… where you take certain data, figure out the rules that apply to it, and make intelligent guesses with data points you haven’t actually measured experimentally. If your car passes a fence post every 10 seconds at 50km/h, can you figure out how fast you’d need to be going if you wanted to pass a fence post every one second? You can measure and graph it at 50, 100 and maybe even 150km/h… and if you plot that, there’s a perfect straight line to show you you’d need to be going 500km/h. Much easier than trying to do it experimentally.
Of course, if you’re relying on the graph to give you the answer, it’s important the measurements be accurate because a couple of dots just a bit off will move the line significantly. An extrapolation of absolute zero that’s +/- 3 degrees of the real answer is a good result.
But I chose to start at the finish line… and found exactly where, on the graph, absolute zero would be (-273.15 C.)… and drew my line from there to my first data point. And then, magically, all of my results landed perfectly onto the line.
When the teacher was handing back the lab books next class, he stopped at my desk.
“Congratulations on your excellent result, Mr. Kemeny.”
“Thank you, sir.”
“Don’t you find it extraordinary that, armed with just some rudimentary equipment, you managed to find a result accurate to within a 10th of a degree?”
“It’s quite remarkable, sir.”
“How do you explain it?”
“It must be due to the excellent science instruction I’ve been receiving in this course, sir.”
“Thank you, but I’m not that good. Please keep in mind, Mr. Kemeny, that life rarely offers you shortcuts.”
“I suppose that means that when it does, we should take them?”
He just handed me back the lab book. I got 8/10. Everyone else got 10. I didn’t argue.
Looking at today’s B.C. graph, it’s a linear descent towards zero new cases a day. Like bad data, a couple of bad days can significantly affect the landing point, but until it does, let’s have a bit of fun with the numbers.
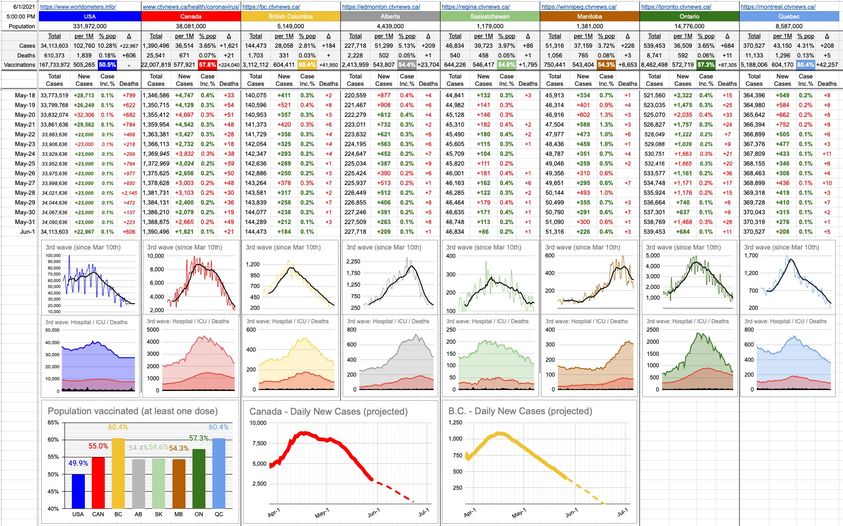
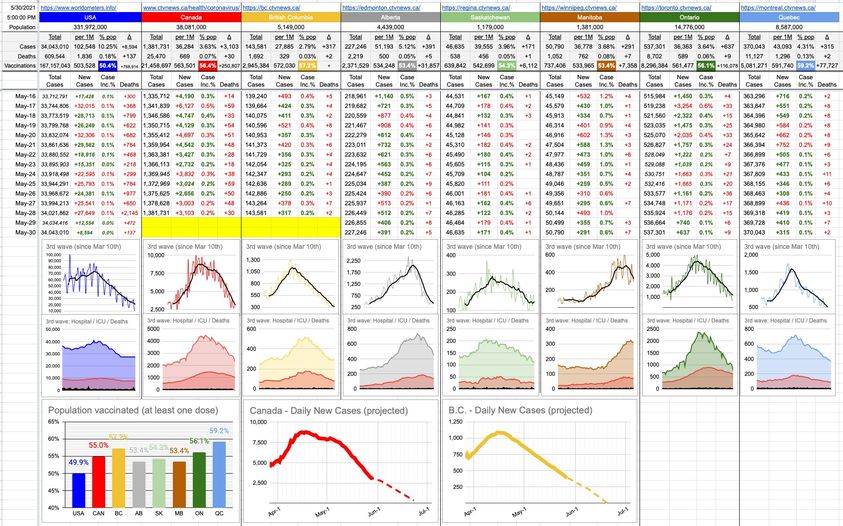
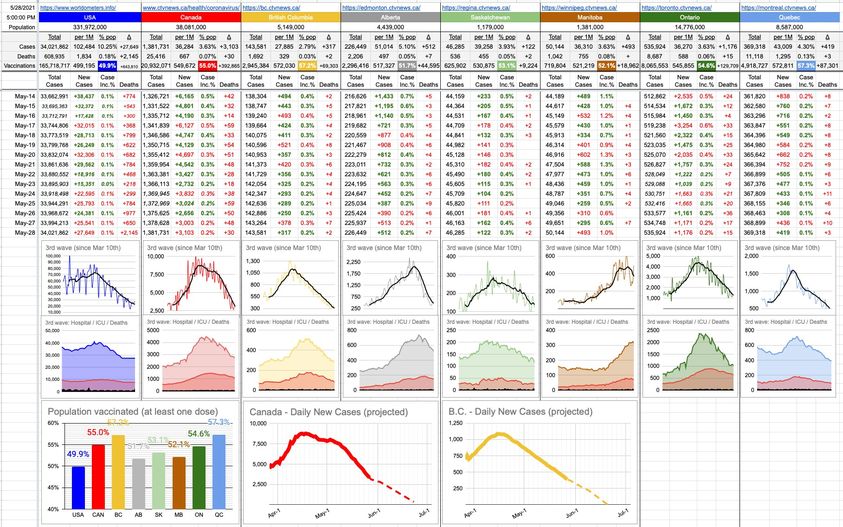
You’ll see below three new graphs. The first one is a consolidation of all of the vaccination rate graphs. Yes, we get it, they’re all going up, nobody is getting un-vaccinated, and those graphs are small enough that the nuanced differences between provinces are indistinguishable. So now, they’re all on one graph… if you want to compare apples to apples.
The other two graphs, as per above, are extrapolations… one is Canada and the other is B.C. The thick line is the real data up to today. The dotted line is where we’re headed if nothing changes. This is still very much a work in progress… so, we shall see. I’m no expert… just some guy plotting points and drawing lines.
It’d be nice to be able to work backwards; certainly, it’s what our provincial health ministry has tried to do with our 4-step re-opening plan… but here we’re stuck doing the actual experiment… and, it should be noted… if these numbers and graphs are anywhere close to reality, we will easily achieve the targets of out provincial 4-set plan. I’d certainly give that a well-deserved 10/10.
May 26, 2021
Just to briefly touch upon a big question mark… that’s slowly being answered as research emerges… what’s the deal with the delayed second doses? Why are we playing with the science, etc…
To rewind a bit, let’s remember that the timeline for these vaccines to be released into the wild was compressed – things happened much faster than usual. This doesn’t mean the science was skipped or compromised; it was the bureaucracy around it.
That being said, in an effort to get the thing out the door as quickly as possible, a different sort of question was asked; not one that’s typically asked of vaccines.
The question was: What’s the shortest period of time where a two-shot regimen would be effective? It was known that one dose of an mRNA vaccine wouldn’t generate enough of a response… and the answer to the question of spacing doses has two answers, because there are two different questions. One is how soon can it be to be effective? And two is… what’s ideal?
The former question was chosen to be answered in the same way that many of life’s problems get solved – decide what’s most important. “Good enough” far outweighs “Ideal” in this case, and that’s what we got. This is not to say that people who got the shots 3 weeks apart got anything bad; on the contrary… that’s what was tested, verified safe, and verified effective with a 95% efficacy.
So, what’s the problem? There is no problem… but now we have enough time and data to answer question two, and it’s what most experts expected… because it’s what’s typically seen with these sorts of vaccines.
Anyone who’s ever had a vaccine booster barely remembers the timing of what’s being boosted. It’s often measured in years… or, at best, months. Never weeks. My recent Shingrix vaccine against Shingles had a follow-up booster that was to be taken within two to six months after the first dose. But what’s optimal? 2? 4? 6? I couldn’t find anything to support a more specific number, but the answer to all of them was “good enough”.
The answer to the optimal spacing of C19 mRNA vaccines… as it turns out, while 3 weeks is certainly good enough, it seems waiting a little longer is “better”. It should be noted that “better” in this context is similar to how, for the purposes of putting out a candle, a firehose is “better” than a garden hose.
Specifically, for Pfizer… people who received their booster 11 to 12 weeks after their first dose were found to have 3.5 times higher peak-antibody levels.
It’s quite likely this is the same for Moderna. And it’s certainly turned out to be the case for AstraZeneca… just ask the U.K.
The whole point of this isn’t really to say what’s “better” – it’s more to point out what’s “not worse”… and the answer is… all of it. All of it is “not worse”. If you’re getting a second jab, you’re good… no matter when. And yes, of course… if the second jab is 5 years from now, it’s a different story. But it won’t be; given supply and demand… everyone is falling into that range… from “good enough” to “more than good enough”.
This big question mark has been shrinking consistently as more and more results emerge, and I expect it’ll vanish by the time any of us need a 3rd booster. In fact, by then, it’s possible we’ll have learned that all that’s needed from now on is a once-a-year boost – one that could easily be combined with the annual flu shot. Either way, one big question mark extinguished.
Share...
June 26, 2021
On a completely different topic… man, it’s hot as Hell out there… and speaking of Hell – here’s a good segue… you know who belongs in hell? Paul Bernardo… who was briefly in the news a few days ago, and will be again in the future.
Paul Bernardo is brutally psychotic rapist and murderer who was put away decades ago, but as long as he’s alive, we’ll keep hearing his name every few years.
Here is the Paul Bernardo news cycle from now on:
parole hearing/denied
parole hearing/denied
parole hearing/denied
dead.
Not sure how many cycles there will be, but you get the idea. It ends when he finally arrives in Hell.
When Canada abolished the death penalty in 1976, they instituted the “faint hope” clause… which, after fifteen years of a life sentence, allowed the convict a chance to ask for a parole hearing… a long-shot chance to get out… one that would never apply to monsters like Bernardo, but the hoops need to be jumped through… and it’s problematic, because it requires testimony, often from the families of the victims… tearing open wounds from the past – every 2 or 3 years.
The idea behind all of this was that if the convict thought he’d have a small chance… effectively, a small chance in hell… perhaps he’d behave better and make better efforts to better himself, etc. Most of those dangerous offenders are beyond rehabilitation, so the whole thing is a pretty big and expensive and stressful waste of time.
Accordingly, the whole faint hope thing was abandoned in 2011, but everyone whose crimes occurred before that were “grandfathered”, so they still get to play the game… a game that will die off along with these remaining prisoners. Then, they can all hang out in Hell together.
You’d think I that’s all I have to say on this particular topic, but I’ll tell you a interesting story related to all of this… some other time. Right now, I’m going to go cool off… because, do you know how hot it is? Exactly.
June 25, 2021
When this pandemic started, my daughter Sophia had recently started grade 11. That was at the time when we were all worrying about this getting totally out of control; watching those exponential-growth graphs; looking closely at the TTD (Time To Double) numbers. I can still tell you… that if cases are growing at 10%, they’ll double in a week. At 6%, it’ll take 12 days.
Slowly, those percentages dwindled to the point where they became far less concerning… and, eventually, irrelevant. Today’s percentages are actually close enough to zero that unless something drastic happens, I should just remove them. But in March of 2020, that number was over 40% in Quebec… a TTD of 2. Cases doubling every two days. Today, that number is 0.02%. Go Habs.
And that’s not the only thing that’s changed. Sophia went from grade 11 to grade 12, and today is the last day of that particular adventure. Right around the time I’m posting this, she and her classmates will be walking across the stage, receiving their well-deserved awards and diplomas, and putting the whole high-school experience (with a pandemic thrown in for good measure) behind them.
The crappy part is I can’t be there. I’m watching the livestream from home, as are all the other parents. The good part is that family from all over the world can also watch. And even though I’m not there, I think the screaming and cheering at the TV will be loud enough that even though the school is several kilometres away… they’ll hear it.
For Sophia, the end of a big adventure… and, also, the start of an even bigger one.
For us… well, this uncalled-for adventure isn’t quite over yet… but if we were all in grade 12, we’d be at the point where the final papers are all handed in, and all of the exams have been written. The stage is set… and soon, we all get to walk across it. And then we get to collectively throw our caps (ie masks) in the air and, with the same sense of anticipation being felt by this awesome group of graduates… get on with our lives.
June 24, 2021
Bruce Hornsby has had more than one hit in his illustrious career… he’s no “one hit wonder”… but if you’ve ever heard of him, there’s no doubt you know his most famous song. And maybe that’s the only one you know. If he’d never written another song, his legacy may not be that different. It was pretty much the first thing he ever put out… it won Grammys, it went multi-platinum, etc. Deservedly so. And for many, that’s the last they remember of him.
The song, of course, is “The Way It Is”.
Bruce Hornsby’s song answers a lot of questions (that are typically rhetorical, but shouldn’t be) with that answer. Why Black segregation? Why such a divide between rich and poor? That song would go on for years if you kept adding relevant questions to it. Any well-entrenched part of society that’s unfair, unbalanced and/or just plain insane – gets defended by that answer.
The answer, “that’s just the way it is” is the ultimate cop-out. The ultimate passing the buck. The ultimate “not my problem”.
That song came out right around my 18th birthday, just a few months after graduation. And that is exactly the age where teens get thrown into the real world. Accordingly, they look around at where they landed… and ask lots of questions. And that particular answer is never accepted graciously.
Side-note, it was an argument with a university prof that was the final nail in the coffin of my academic career… me telling her that her sorting algorithms may have been great in the past, but recent advances in computer theory — and the languages that have emerged as a result — offer other possibilities. Nope, it’s her way or the highway. And her final response to my well-thought-out and logical and correct arguments? Too bad… that’s just the way it is.
After all is said and done, once this pandemic is over, we’re all looking forward to getting back to normal. Or are we? What, exactly, *is* normal?
Getting into your car, driving 25 minutes in rush-hour gridlock, finding parking that’s $19.00 for the first hour and then ten cents an hour for the rest of the day – when all you need is 30 minutes… wandering into an office and waiting, being guided into a room with lots … [Continue Reading]
June 23, 2021
Let’s take a closer look at out neighbours to the south, where the overall single-jab vaccination rate is around 54% and stagnating…
The top-10 most vaccinated states are: Vermont, Massachusetts, Hawaii, Connecticut, Maine, New Jersey, Rhode Island, Pennsylvania, New Hampshire & New Mexico.
Vermont tops the list with a vaccination percentage of 73.1%, while New Mexico rounds out the top-10 with 60.8%.
The bottom 10 looks like this…
North Dakota, South Carolina, Georgia, Arkansas, Tennessee, Idaho, Alabama, Wyoming, Louisiana & Mississippi.
The best of those worst-10 is North Dakota at 43.4%. The worst is Mississippi at 36.0%
That’s quite a divide… where the top state more than doubles the worst one.
Here’s another interesting stat about all of those states…
In the last presidential election, of the top-10, all of them voted Democrat.
Of the bottom-10, 9 of them voted Republican. The one that didn’t, Georgia, is so inwardly-horrified at the result that their Republican-controlled government recently disenfranchised more than 100,000 potential voters, striking them from the rolls… and this was after enacting a number of laws that can only be called “Voter Suppression”. Take a guess which voters are most affected.
None of this is much of a surprise, though the blatant starkness of it is a little eye-opening… but what’s the deal? The blue state/red state divisions largely precede the pandemic, so how does it necessarily follow that raving, unrelenting Trump supporters would also be the anti-mask/anti-vax crowd?
The answer is a bit more complicated than “They’re just a bunch of ignorant rednecks”. The answer, in fact, has a lot to do with distrust of the government. When you’re poor and/or uneducated and/or sick and tired of hearing lies about how the government is going to do so much for you (and then doesn’t), you end up jumping ship to the guy you can relate to… he’s one of us, loud, abrasive, calls it like he sees it, etc. He’s not cut from government cloth.
Which makes Trump all the worse. If anybody could’ve convinced that group about masks and vaccines, it would’ve been him. It could’ve and it should’ve been him. Notwithstanding the shitshow it took to get him elected, it’s like the universe said “Hmm… there’s going to be this pandemic, and a lot of Americans will lose their lives. At least, who could we put in … [Continue Reading]
June 22, 2021
Summer is only one day old, but it’s certainly making a statement. Glorious warm sunshine… hopefully a continuing sign of things to come, and I don’t just mean the weather. Blue skies, calm seas, smooth sailing… pick your metaphor; they all apply.
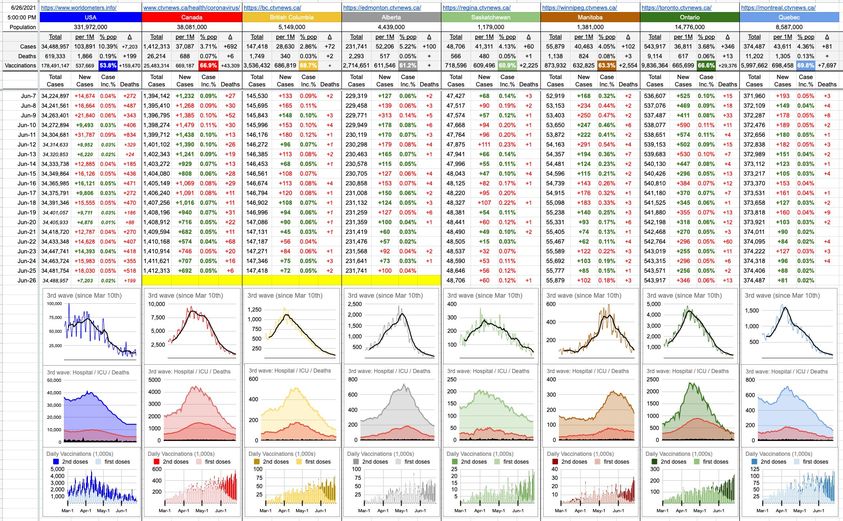
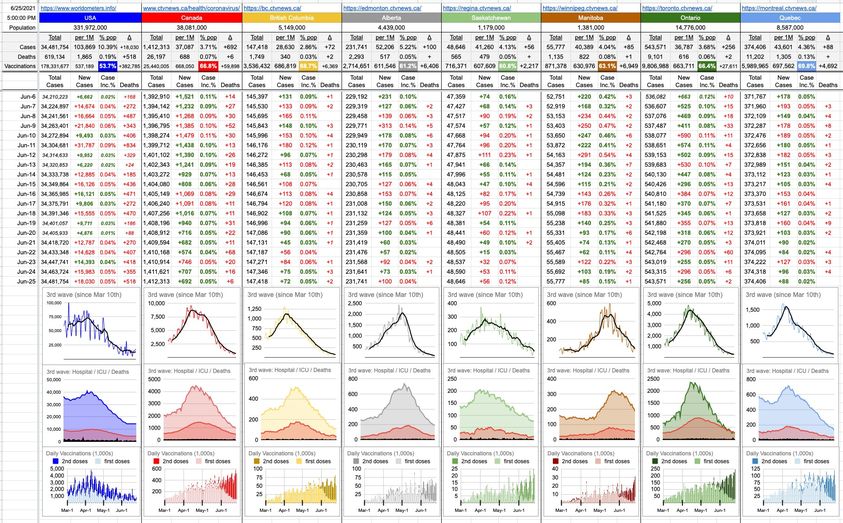
I’ve replaced the usual graphs today with others that are pretty cool to look at… and that tell an interesting story. These are vaccination rates since March 1st… for Canada, the U.S., and the usual provinces we’ve been tracking. These graphs show the daily totals (how “tall” each line is) as well as the breakdown between first and second doses… first doses near the bottom, in the lighter colours… and second doses above them, in the darker colours.
I posted one of these graphs for B.C. recently, but here’s all of them… and what do they tell us…?
First of all, with respect to the Canadian ones – the national one and the individual provinces – you’ll notice that the tips of the lines mostly trend upwards or are, at worst, flat. The flatness of some of those lines, for the moment, has more to do with supply limits than demand shortages. You’ll also note the disparity between first and second doses… a pattern that’s mimicked across the country; sometime around June 1st, there began a big push towards second doses… and today, in all provinces, second doses make up the vast majority of vaccinations. Here in B.C., today… close to 80,000 jabs… of which less than 10,000 were first vaccinations.
It’s also interesting to note what the U.S. graph has to say; that they’ve been doing second doses for a long time, and continue to do so… but with diminishing demand. And first doses…? Today’s levels are less than half of what they were seeing in April.
I’ll keep some version of these graphs around from now on, because… unless things really slide backwards, the story is shifting away from new daily cases and hospitalizations and ICU admissions… and now it’s becoming all about how vaccinated we all are, how immune we all are, and how ready to get back to normal we all are.
On this beautiful day… when B.C. crossed the 1,000,000 fully-vaccinated threshold… when the pharmacy where I got my AZ shot two months ago finally got around to calling … [Continue Reading]


